Geometric objects
How are these two plots similar?
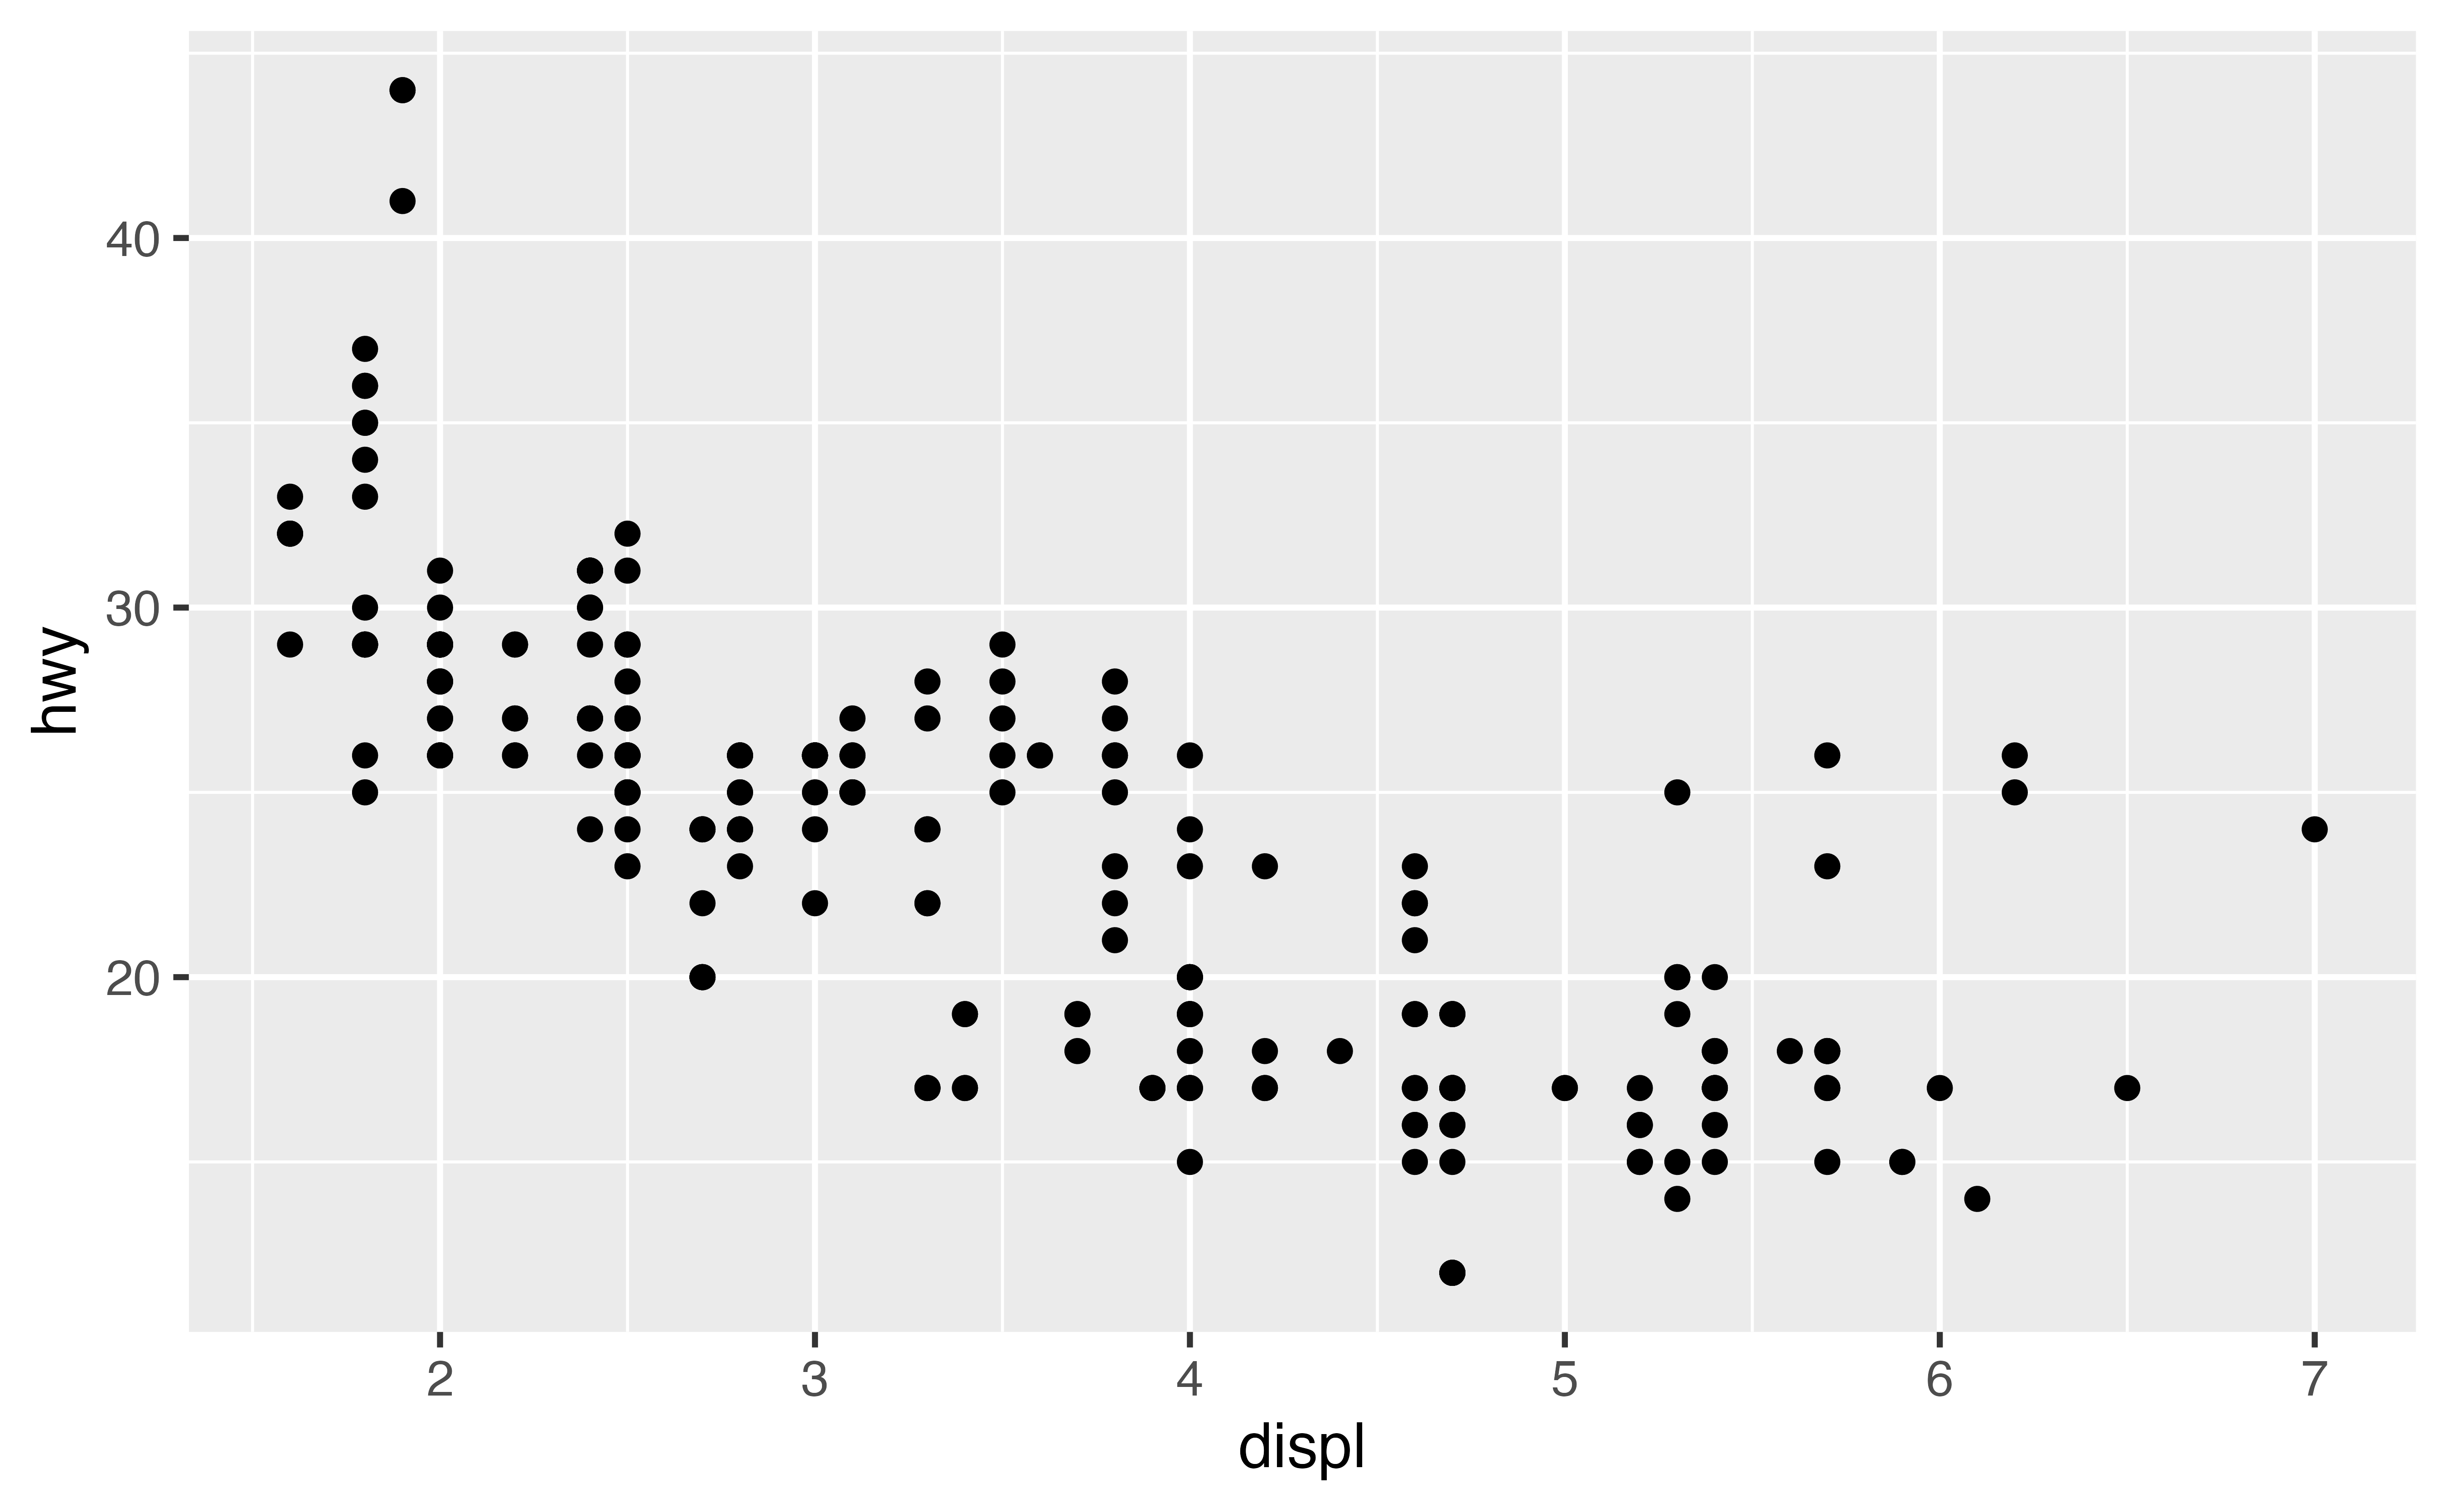
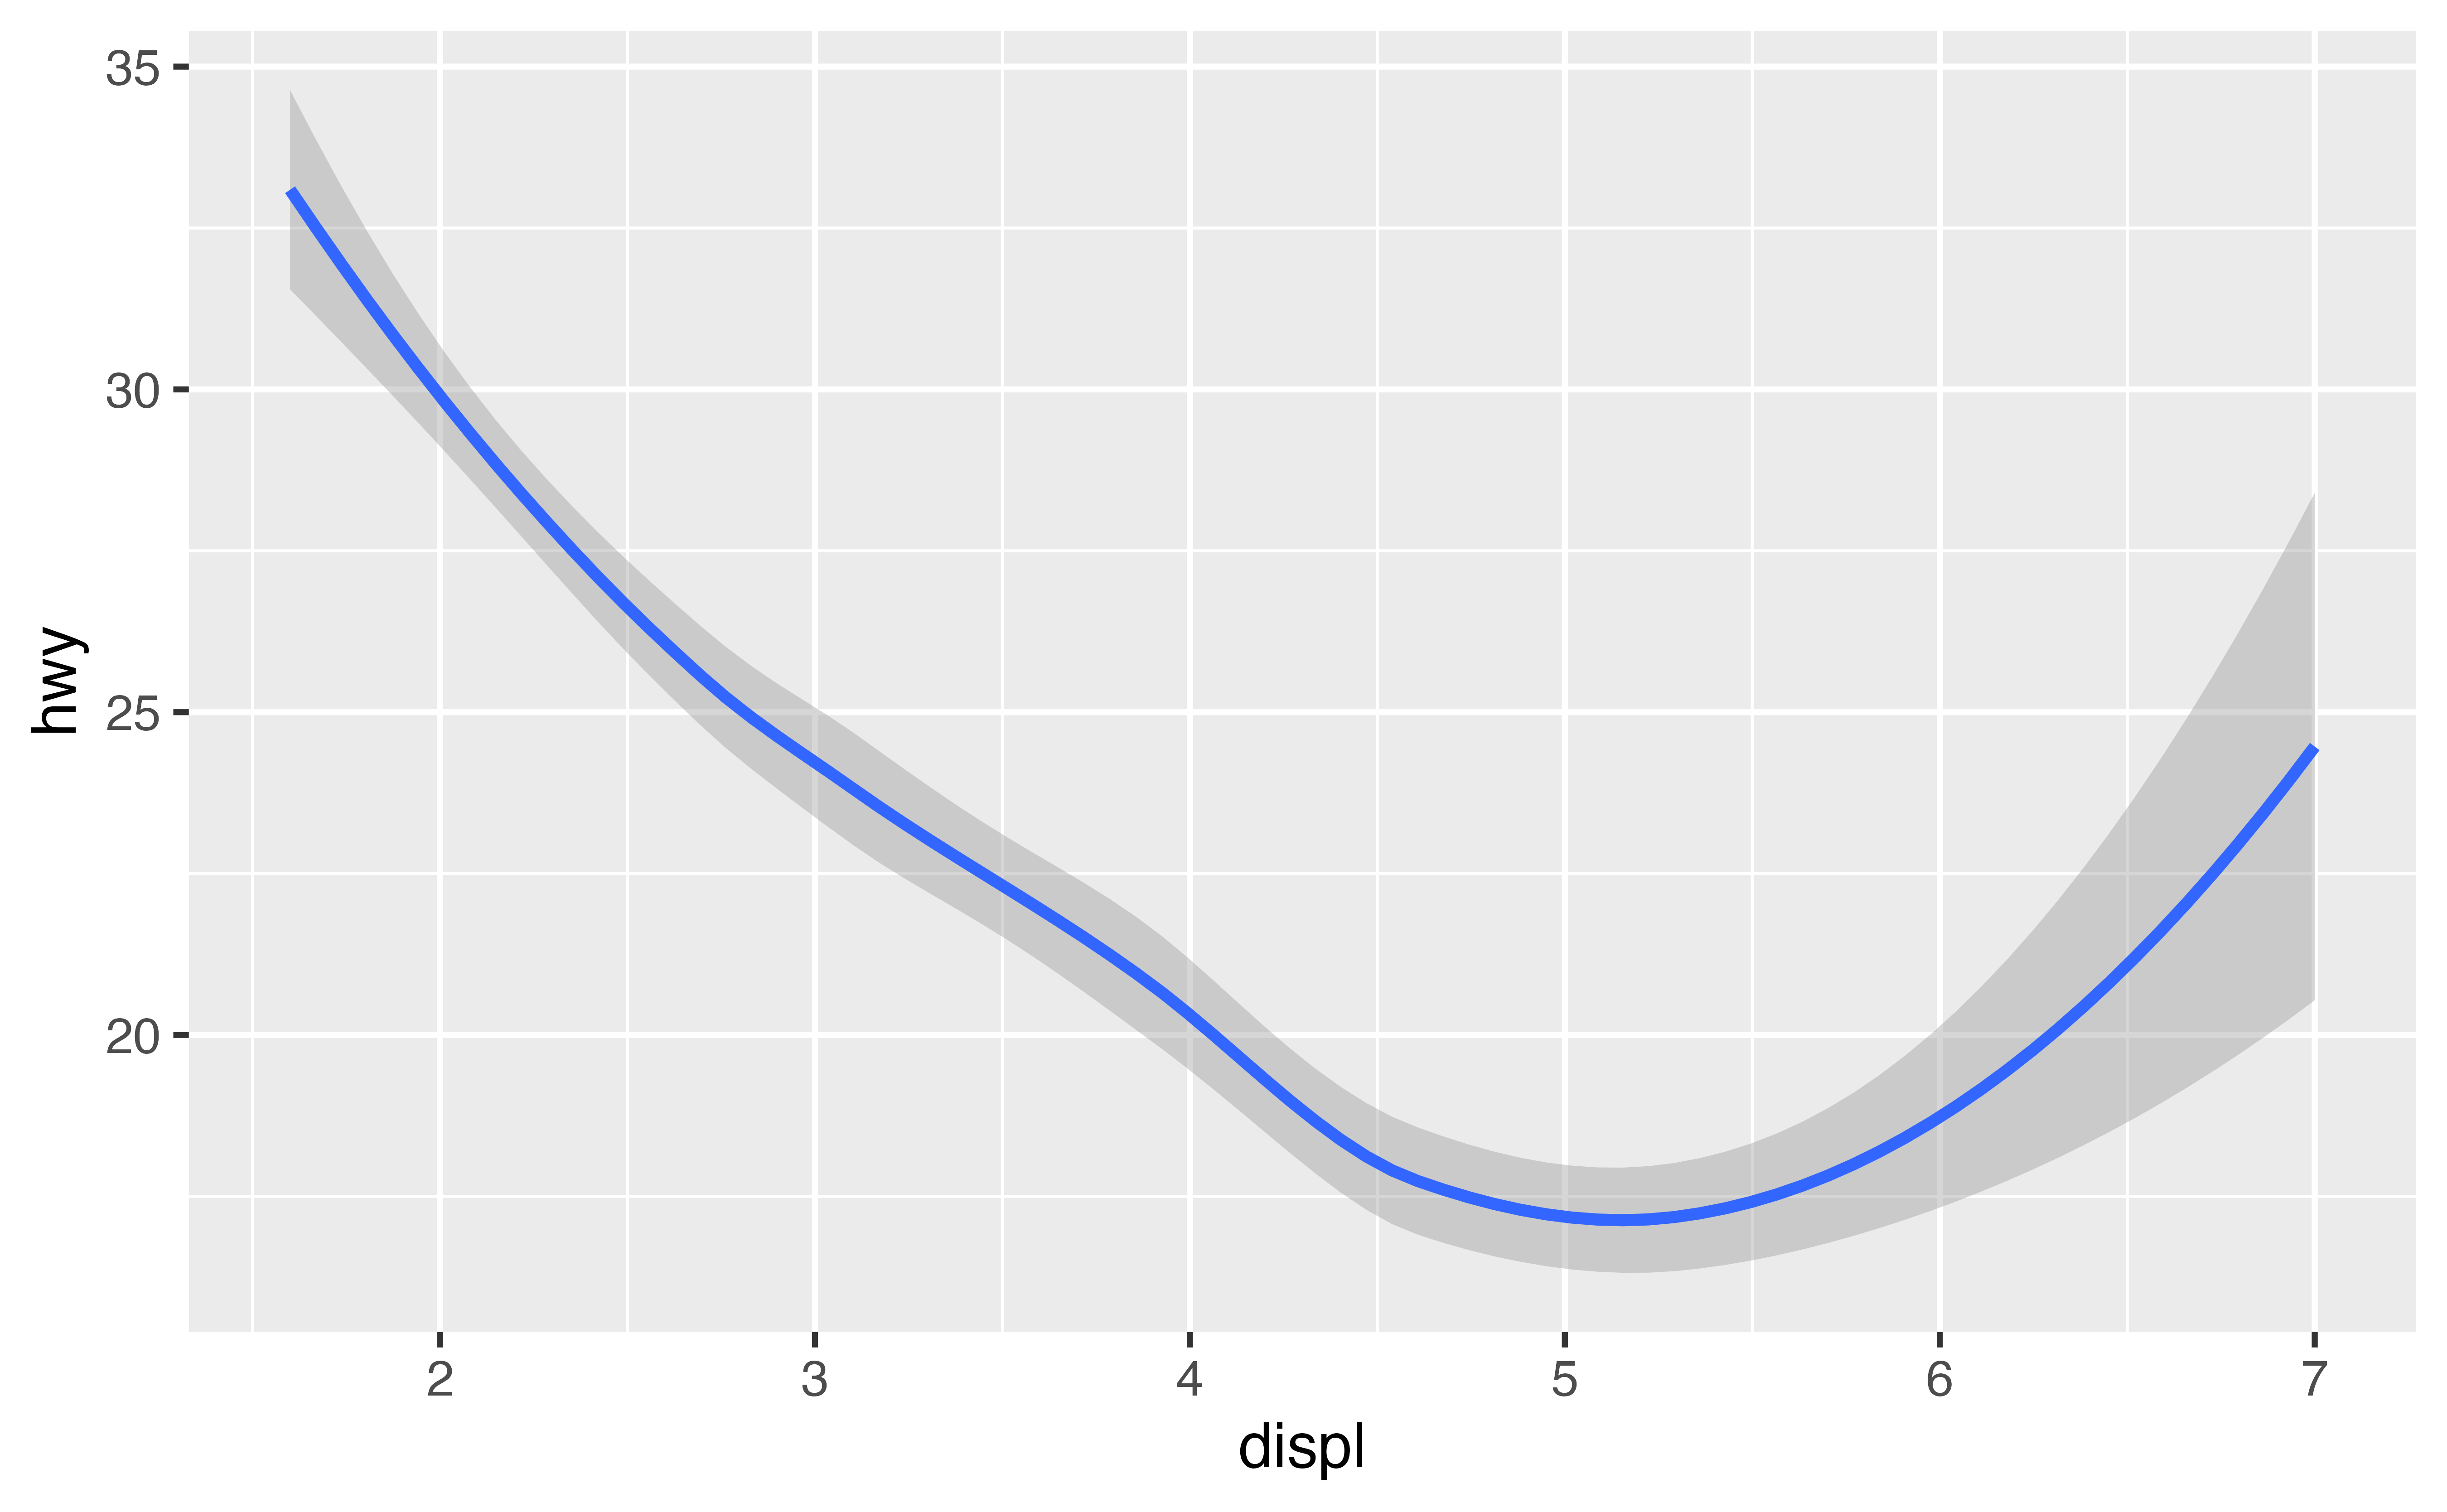
Both plots contain the same x variable, the same y variable, and both describe the same data. But the plots are not identical. Each plot uses a different visual object to represent the data. In ggplot2 syntax, we say that they use different geoms.
A geom is the geometrical object that a plot uses to represent observations. People often describe plots by the type of geom that the plot uses. For example, bar charts use bar geoms, line charts use line geoms, boxplots use boxplot geoms, and so on. Scatterplots break the trend; they use the point geom.
As we see above, you can use different geoms to plot the same data. The plot on the left uses the point geom, and the plot on the right uses the smooth geom, a smooth line fitted to the data.
Geom functions
To change the geom in your plot, change the geom function that you add to ggplot(). For example, take this code which makes the plot on the left (above), and change geom_point() to geom_smooth(). What do you get?
ggplot(data = mpg) +
  geom_smooth(mapping = aes(x = displ, y = hwy))
Good job! You get the plot on the right (above).
More about geoms
ggplot2 provides over 30 geom functions that you can use to make plots, and extension packages provide even more (see https://exts.ggplot2.tidyverse.org/gallery/ for a sampling). You’ll learn how to use these geoms to explore data in the Visualize Data primer.
Until then, the best way to get a comprehensive overview of the available geoms is with the ggplot2 cheatsheet. To learn more about any single geom, look at its help page, e.g. ?geom_smooth.
Exercise 1
What geom would you use to draw a line chart? A boxplot? A histogram? An area chart?
Exercise 2
Putting it all together
The ideas that you’ve learned here: geoms, aesthetics, and the implied existence of a data space and a visual space combine to form a system known as the Grammar of Graphics.
The Grammar of Graphics provides a systematic way to build any graph, and it underlies the ggplot2 package. In fact, the first two letters of ggplot2 stand for “Grammar of Graphics”.
The Grammar of Graphics
The best way to understand the Grammar of Graphics is to see it explained in action: