Overplotting
What is overplotting?
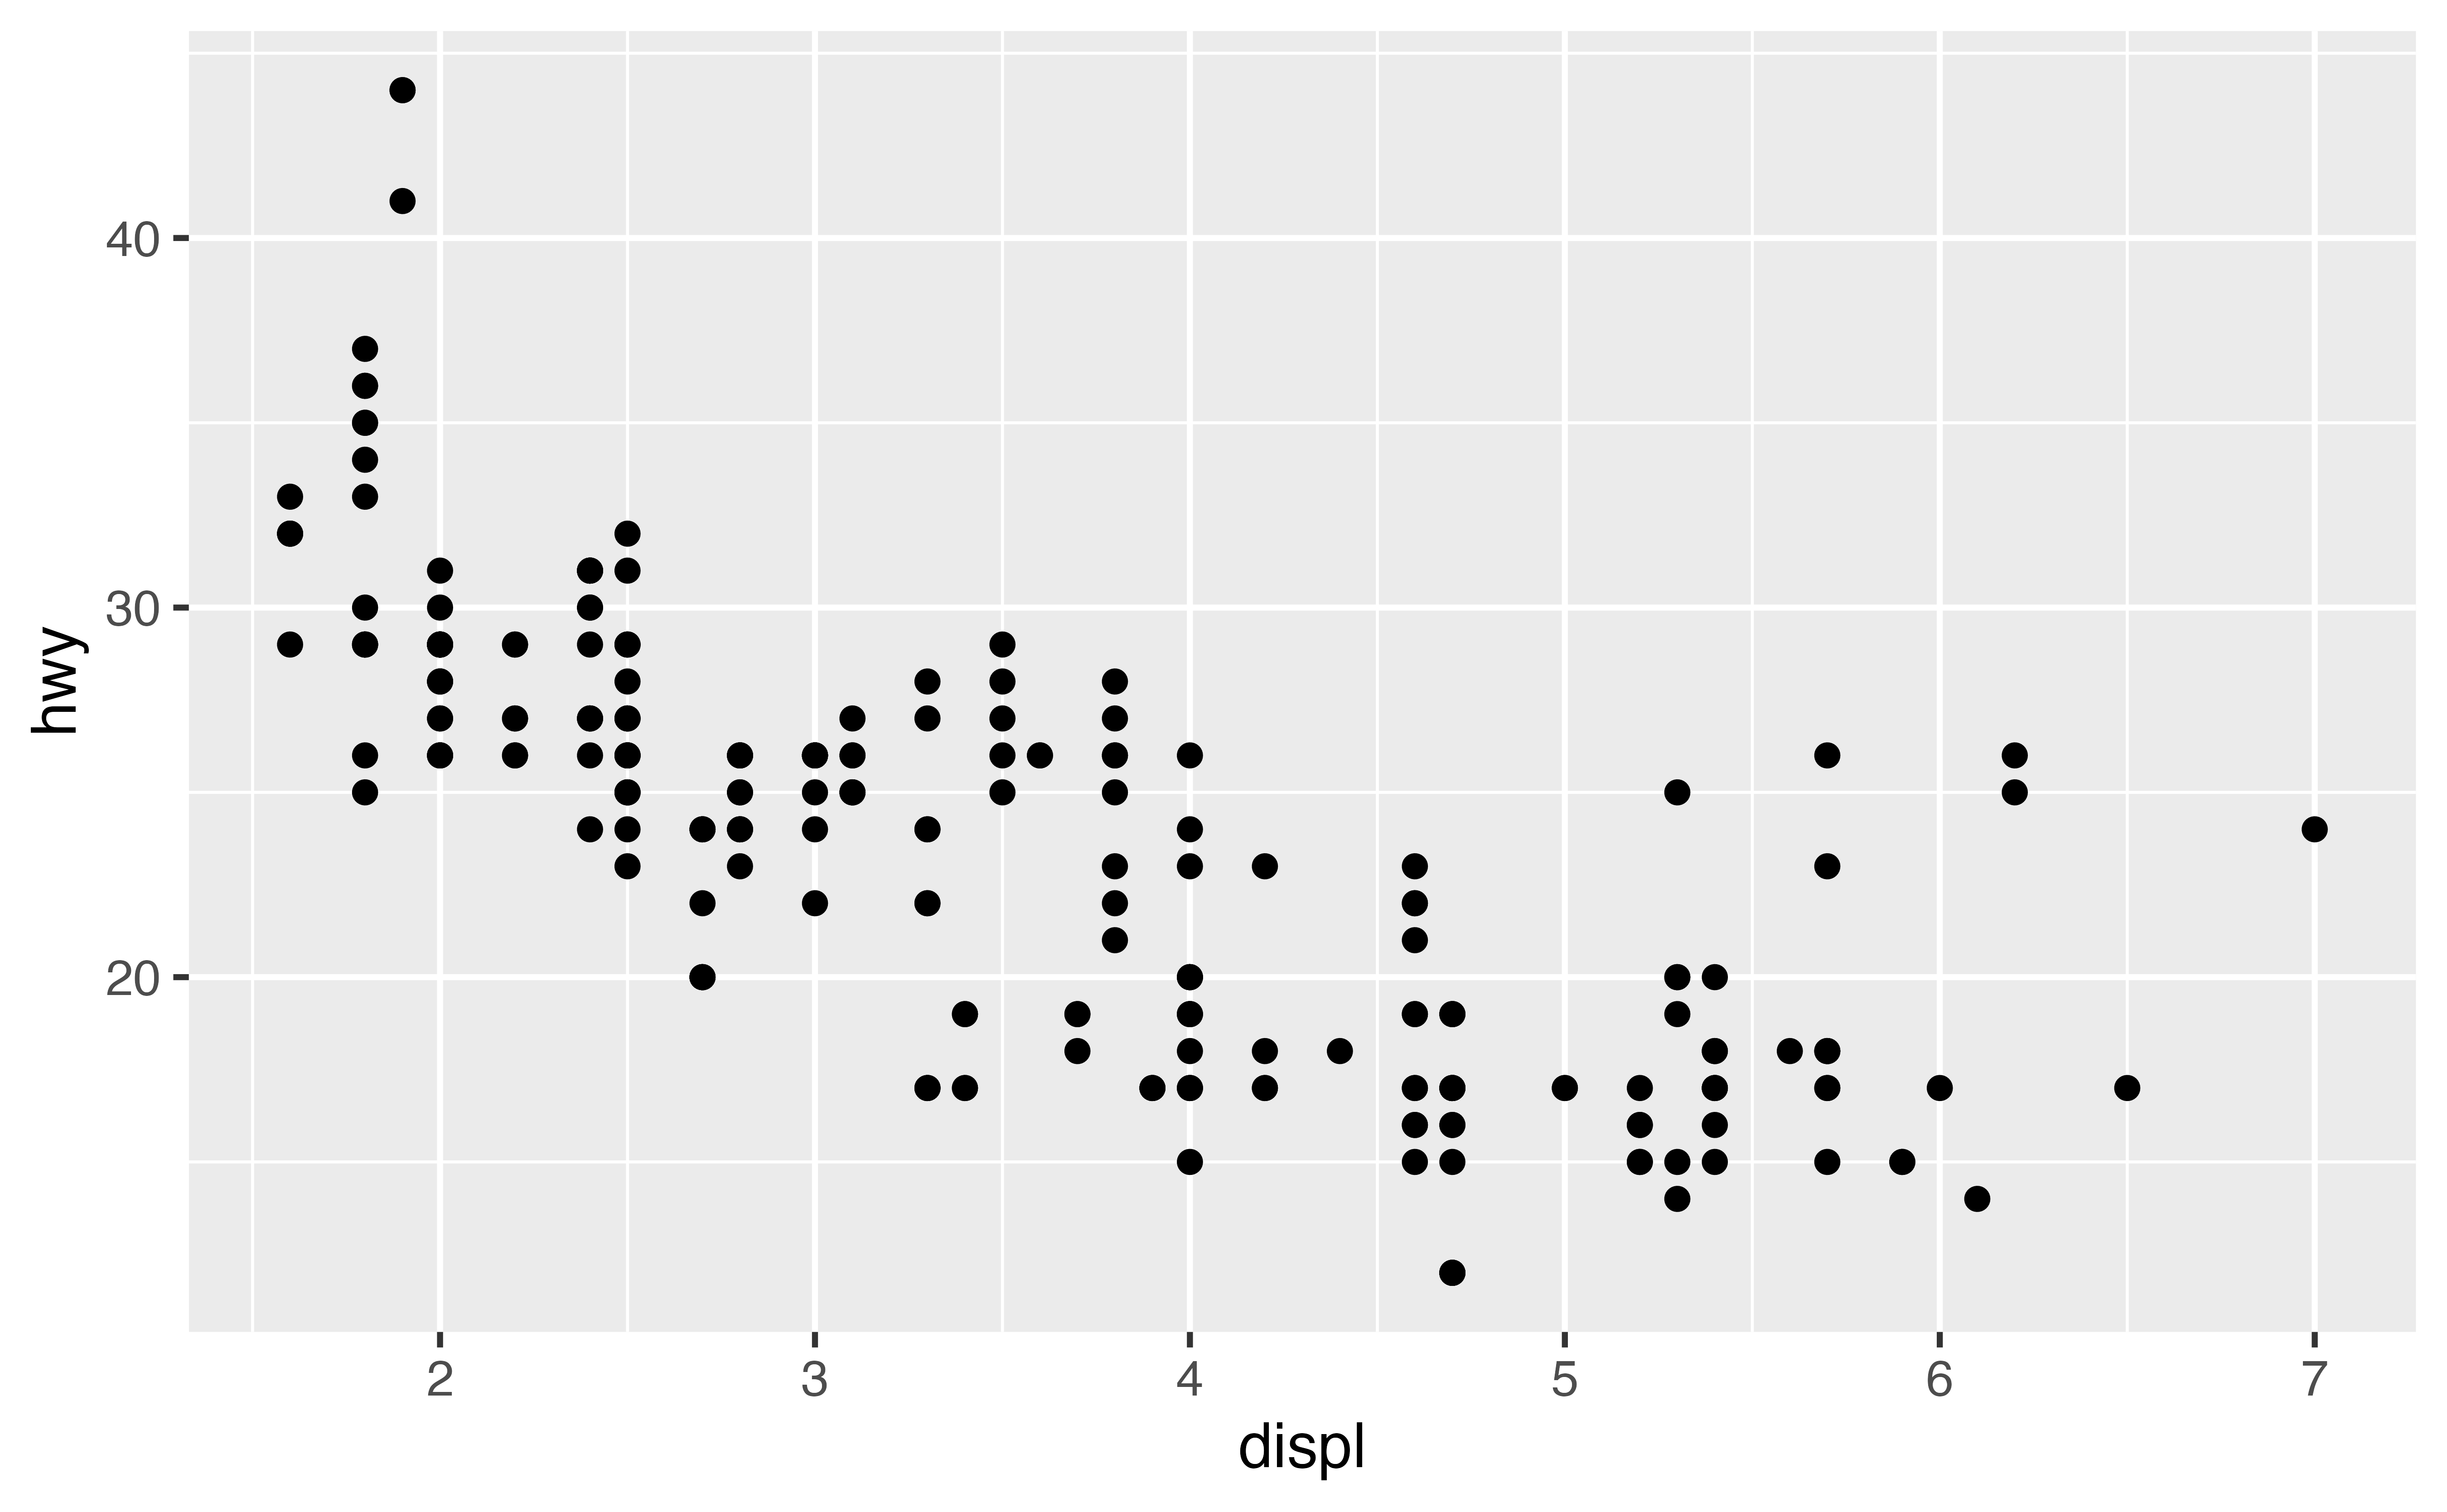
You’ve seen this plot several times in previous tutorials, but have you noticed that it only displays 126 points? This is unusual because the plot visualizes a data set that contains 234 points.
The missing points are hidden behind other points, a phenomenon known as overplotting. Overplotting is a problem because it provides an incomplete picture of the dataset. You cannot determine where the mass of the points fall, which makes it difficult to spot relationships in the data.
Causes of overplotting
Overplotting usually occurs for two different reasons:
- The data points have been rounded to a “grid” of common values, as in the plot above
- The dataset is so large that it cannot be plotted without points overlapping each other
How you deal with overplotting will depend on the cause.