Scales
What is a scale?
Every time you map an aesthetic to a variable, ggplot2 relies on a scale to select the specific colors, sizes, or shapes to use for the values of your variable.
A scale is an R function that works like a mathematical function; it maps each value in a data space to a level in an aesthetic space. But it may be easier to think of a scale as a “palette.” When you give your graph a color scale, you give it a palette of colors to use.
Using scales
{ggplot2} chooses a pleasing set of scales to use whenever you make a graph. You can change or customize these scales by adding a scale function to your plot call.
For example, the code below plots p1 in greyscale instead of the default colors.
p1 + scale_color_grey()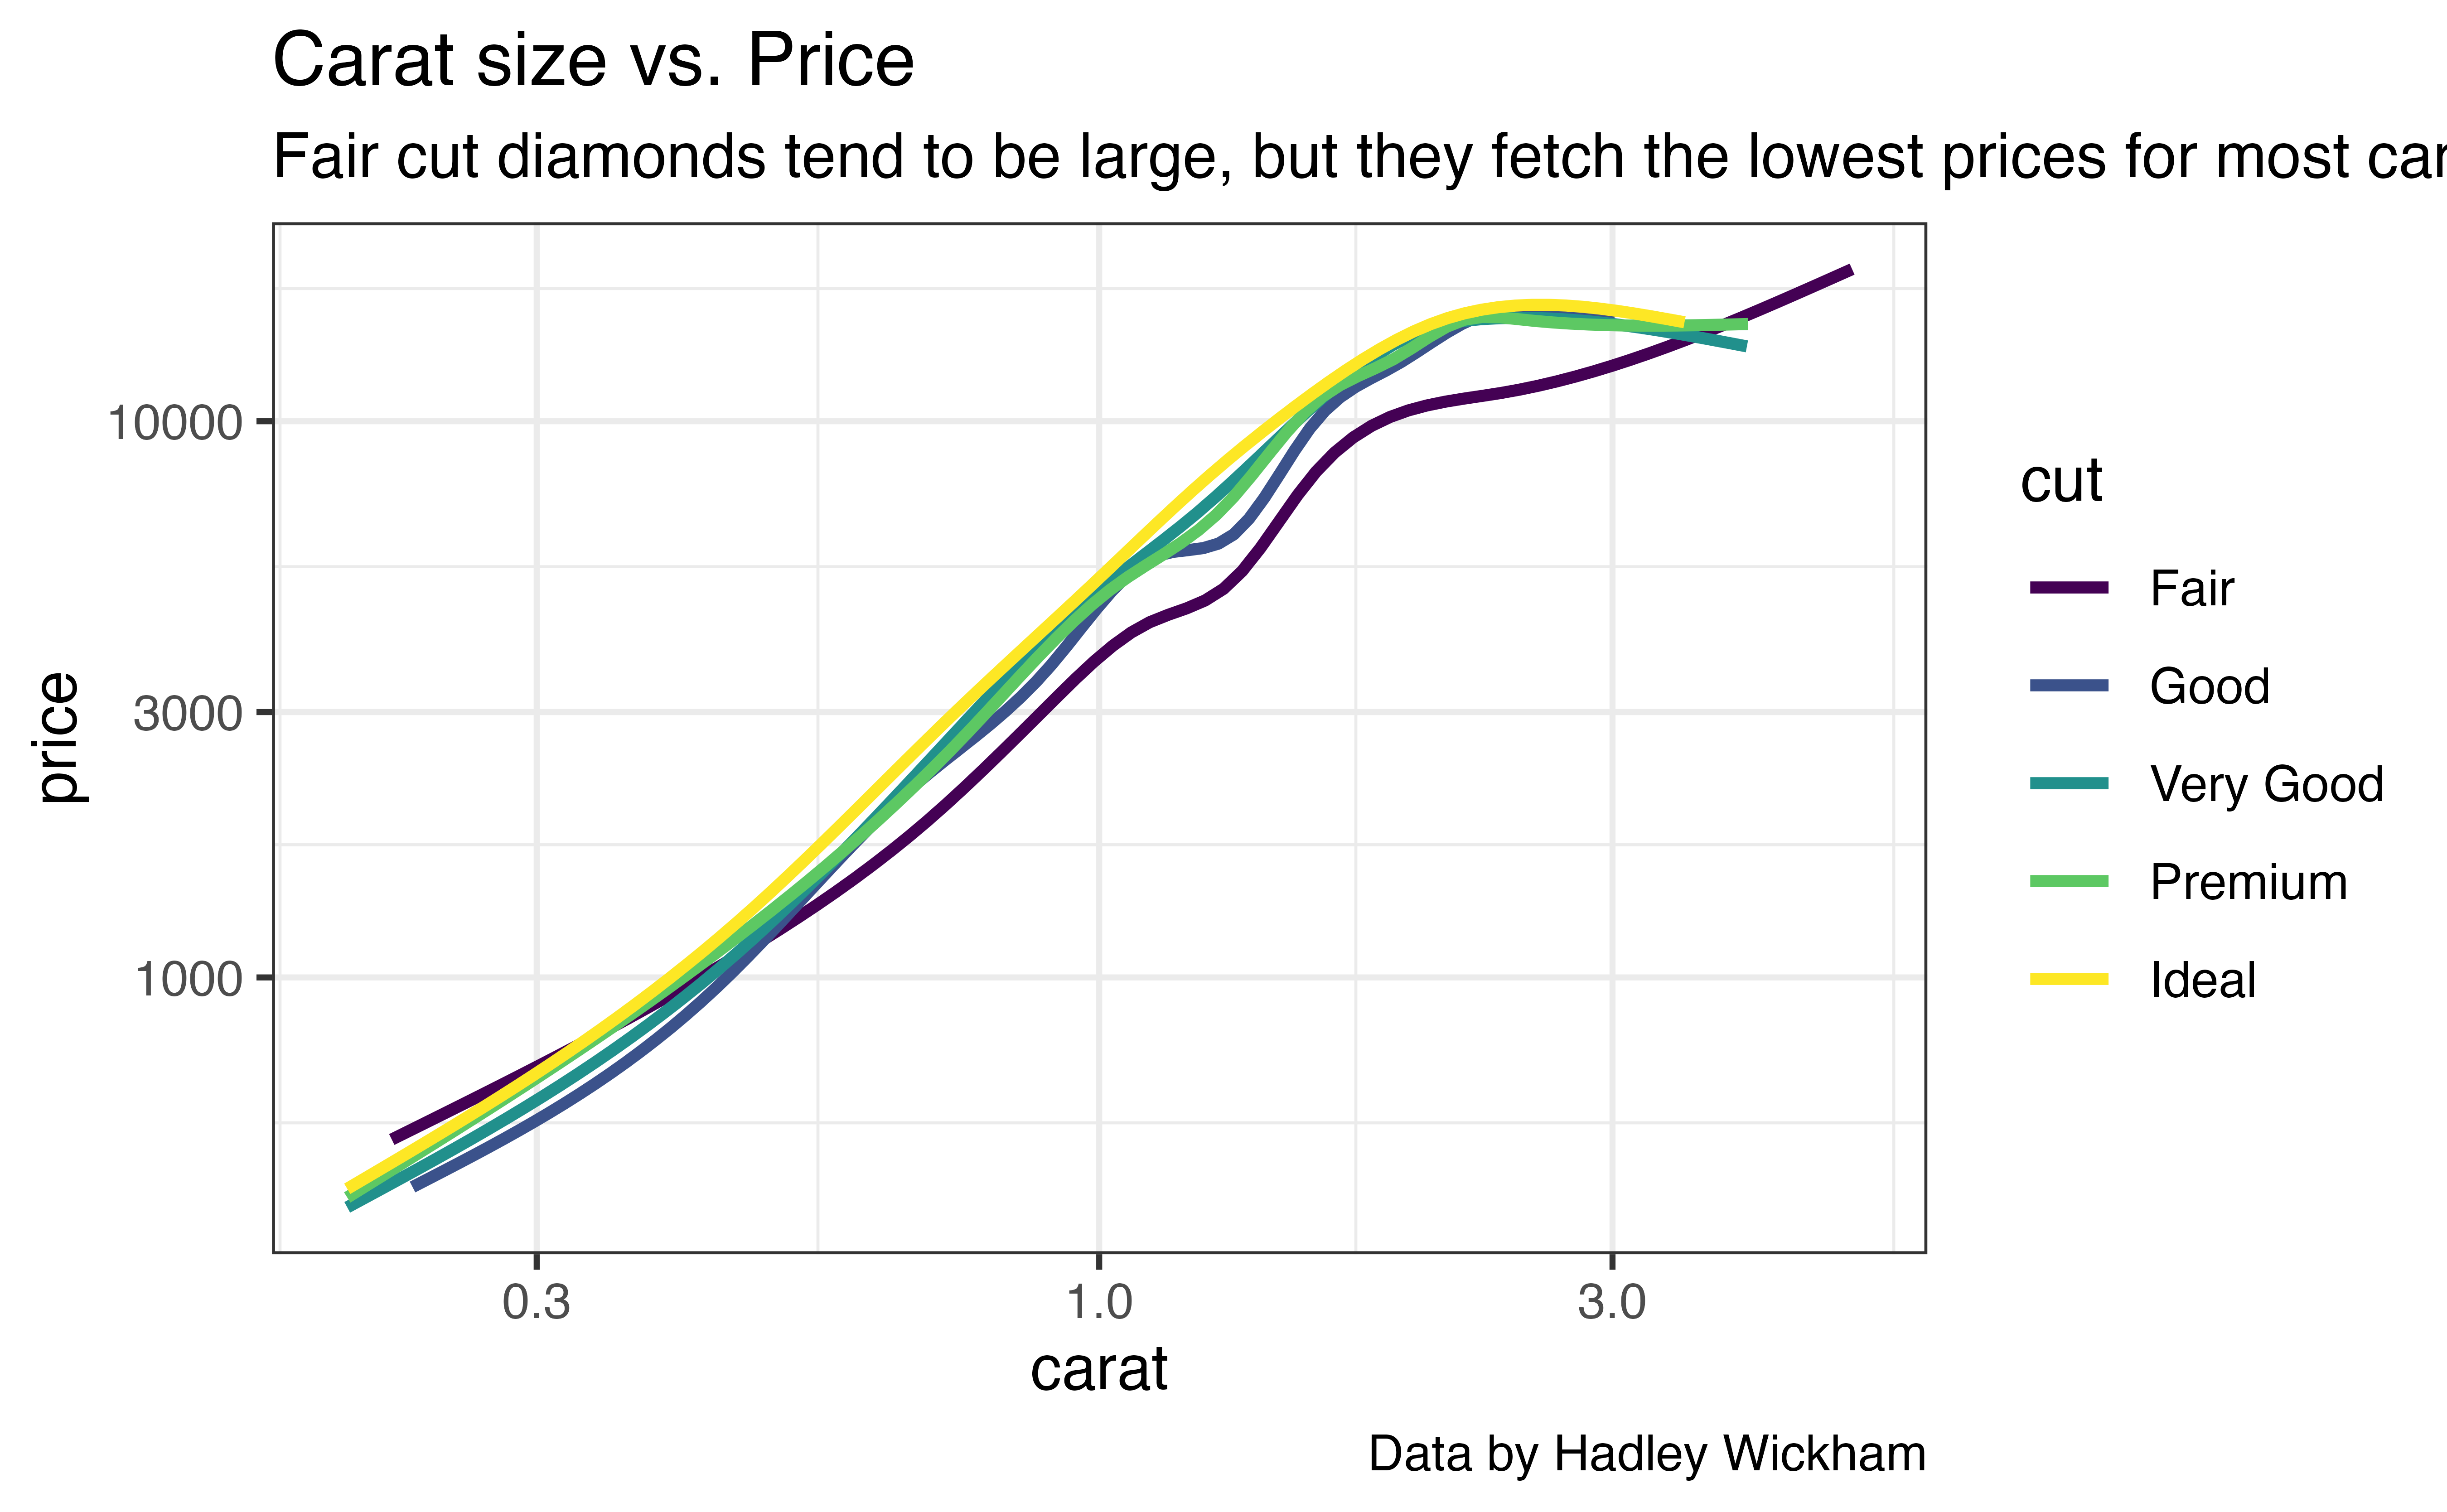
A second example
You can add scales for every aesthetic mapping, including the \(x\) and \(y\) mappings (the code below log transforms the x and y axes).
p1 +
  scale_x_log10() +
  scale_y_log10()
{ggplot2} supplies over 50 scales to use. This may seem overwhelming, but the scales are organized according to an intuitive naming convention.
Naming convention
{ggplot2} scale functions follow a naming convention. Each function name contains the same three elements in order, separated by underscores:
- The prefix
scale - the name of an aesthetic, which the scale adjusts (e.g.
color,fill,size) - a unique label for the scale (e.g.
grey,brewer,manual)
scale_shape_manual() and scale_x_continuous() are examples of the naming scheme.
You can see the complete list of scale names at http://ggplot2.tidyverse.org/reference/. In this tutorial, we will focus on scales that work with the color aesthetic.
Discrete vs. continuous
Scales specialize in either discrete variables or continuous variables. In other words, you would use a different set of scales to map a discrete variable, like diamond clarity, than you would use to map a continuous variable, like diamond price.
scale_color_brewer()
One of the most useful color palettes for discrete variables is scale_color_brewer() (scale_fill_brewer() if you are working with fill). Run the code below to see the effect of the scale.
Good job! scale_color_brewer() applies a color palette from the {RColorBrewer} package, a package that specializes in attractive color palettes.
{RColorBrewer}
The {RColorBrewer} package contains a variety of palettes developed by Cynthia Brewer. Each palette is designed to look pleasing as well as to differentiate between the values represented by the palette. You can learn more about the color brewer project at colorbrewer2.org.
Altogether, the {RColorBrewer} package contains 35 palettes. You can see each palette and its name by running RColorBrewer::display.brewer.all(). Try it below.
Good job! Our graph above used the Blues palette (the default).
Brewer palettes
By default, scale_color_brewer() will use the “Blues” palette from the {RColorBrewer} package. To use a different {RColorBrewer} palette, set the palette argument of scale_color_brewer() to one of the {RColorBrewer} palette names, surrounded by quotation marks, e.g.
p1 + scale_color_brewer(palette = "Purples")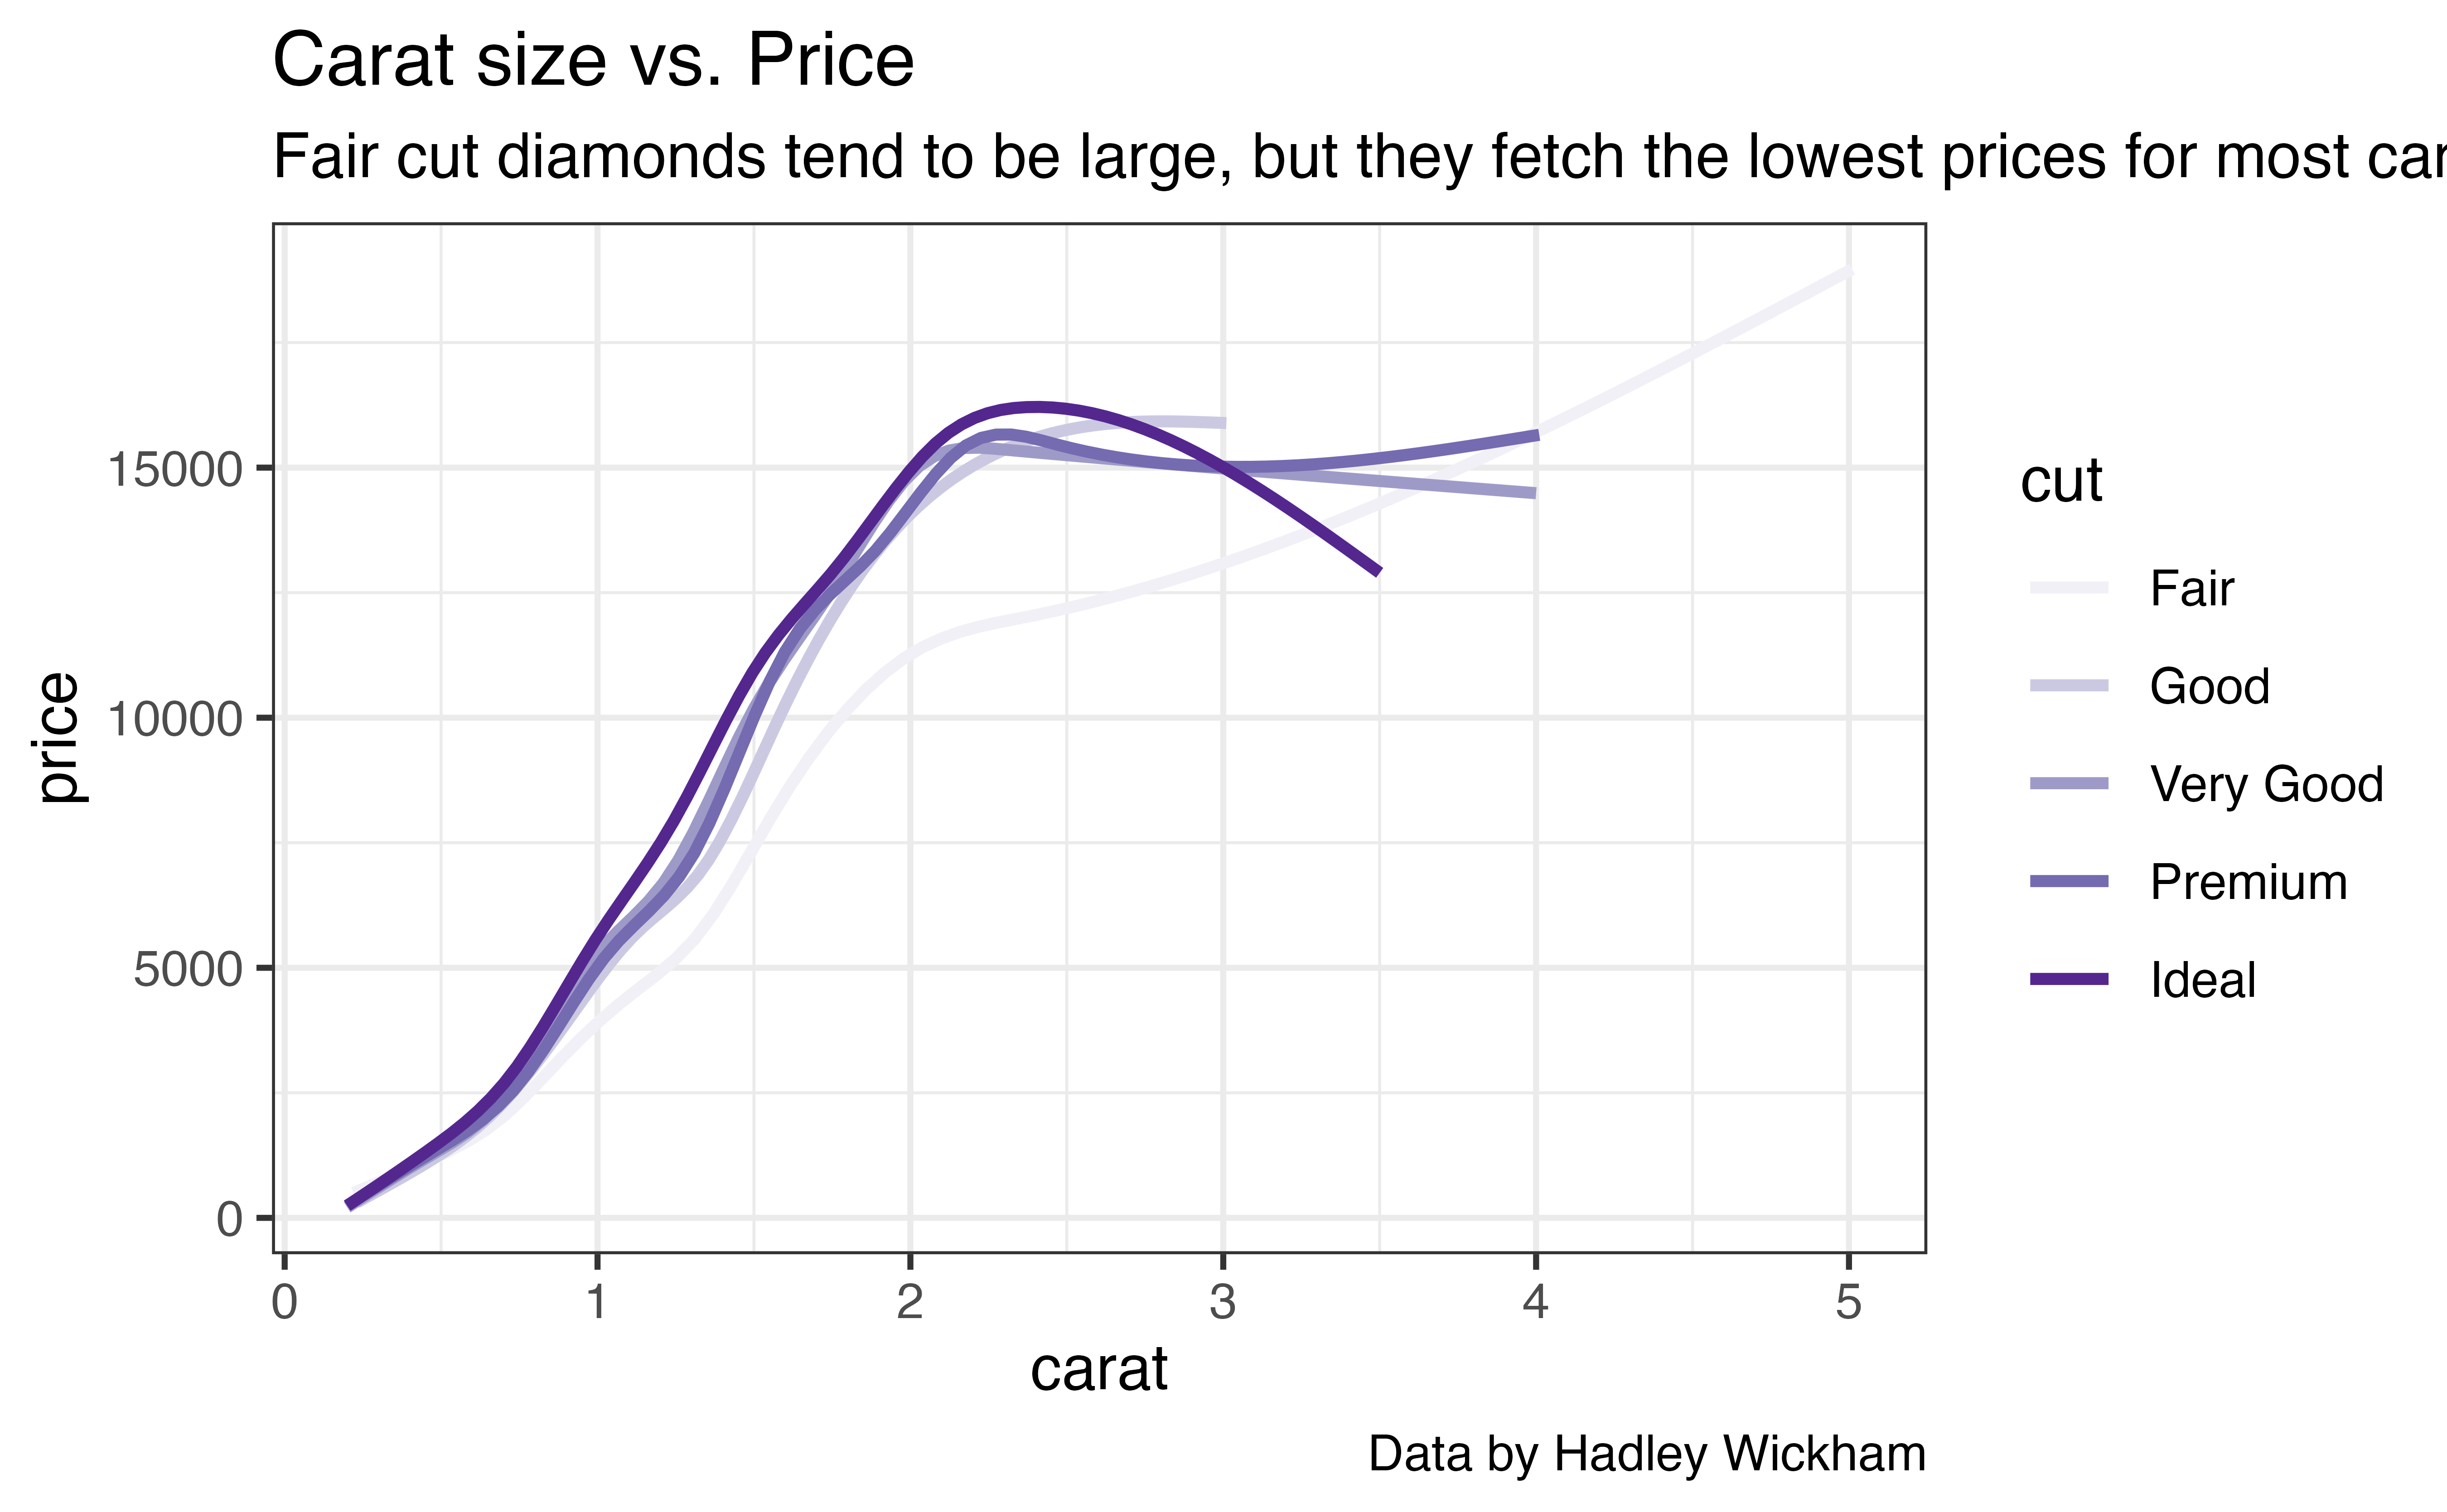
Exercise: scale_color_brewer()
Recreate the graph below, which uses a different palette from the {RColorBrewer} package.
p1 + scale_color_brewer(palette = "Spectral")Good job! scale_color_brewer() is one of the most useful functions for customizing colors in ggplot2 because it does for you the hard work of selecting a pleasing combination of colors. If you’d like to select individual colors yourself, try the scale_color_manual() function.
Continuous colors
scale_color_brewer() works with discrete variables, but what if your plot maps color to a continuous variable?
Since we do not have a plot that applies color to a continuous variable, let’s make one.
p_cont <- ggplot(data = mpg) +
  geom_jitter(mapping = aes(x = displ, y = hwy, color = hwy)) +
  theme_bw()

p_cont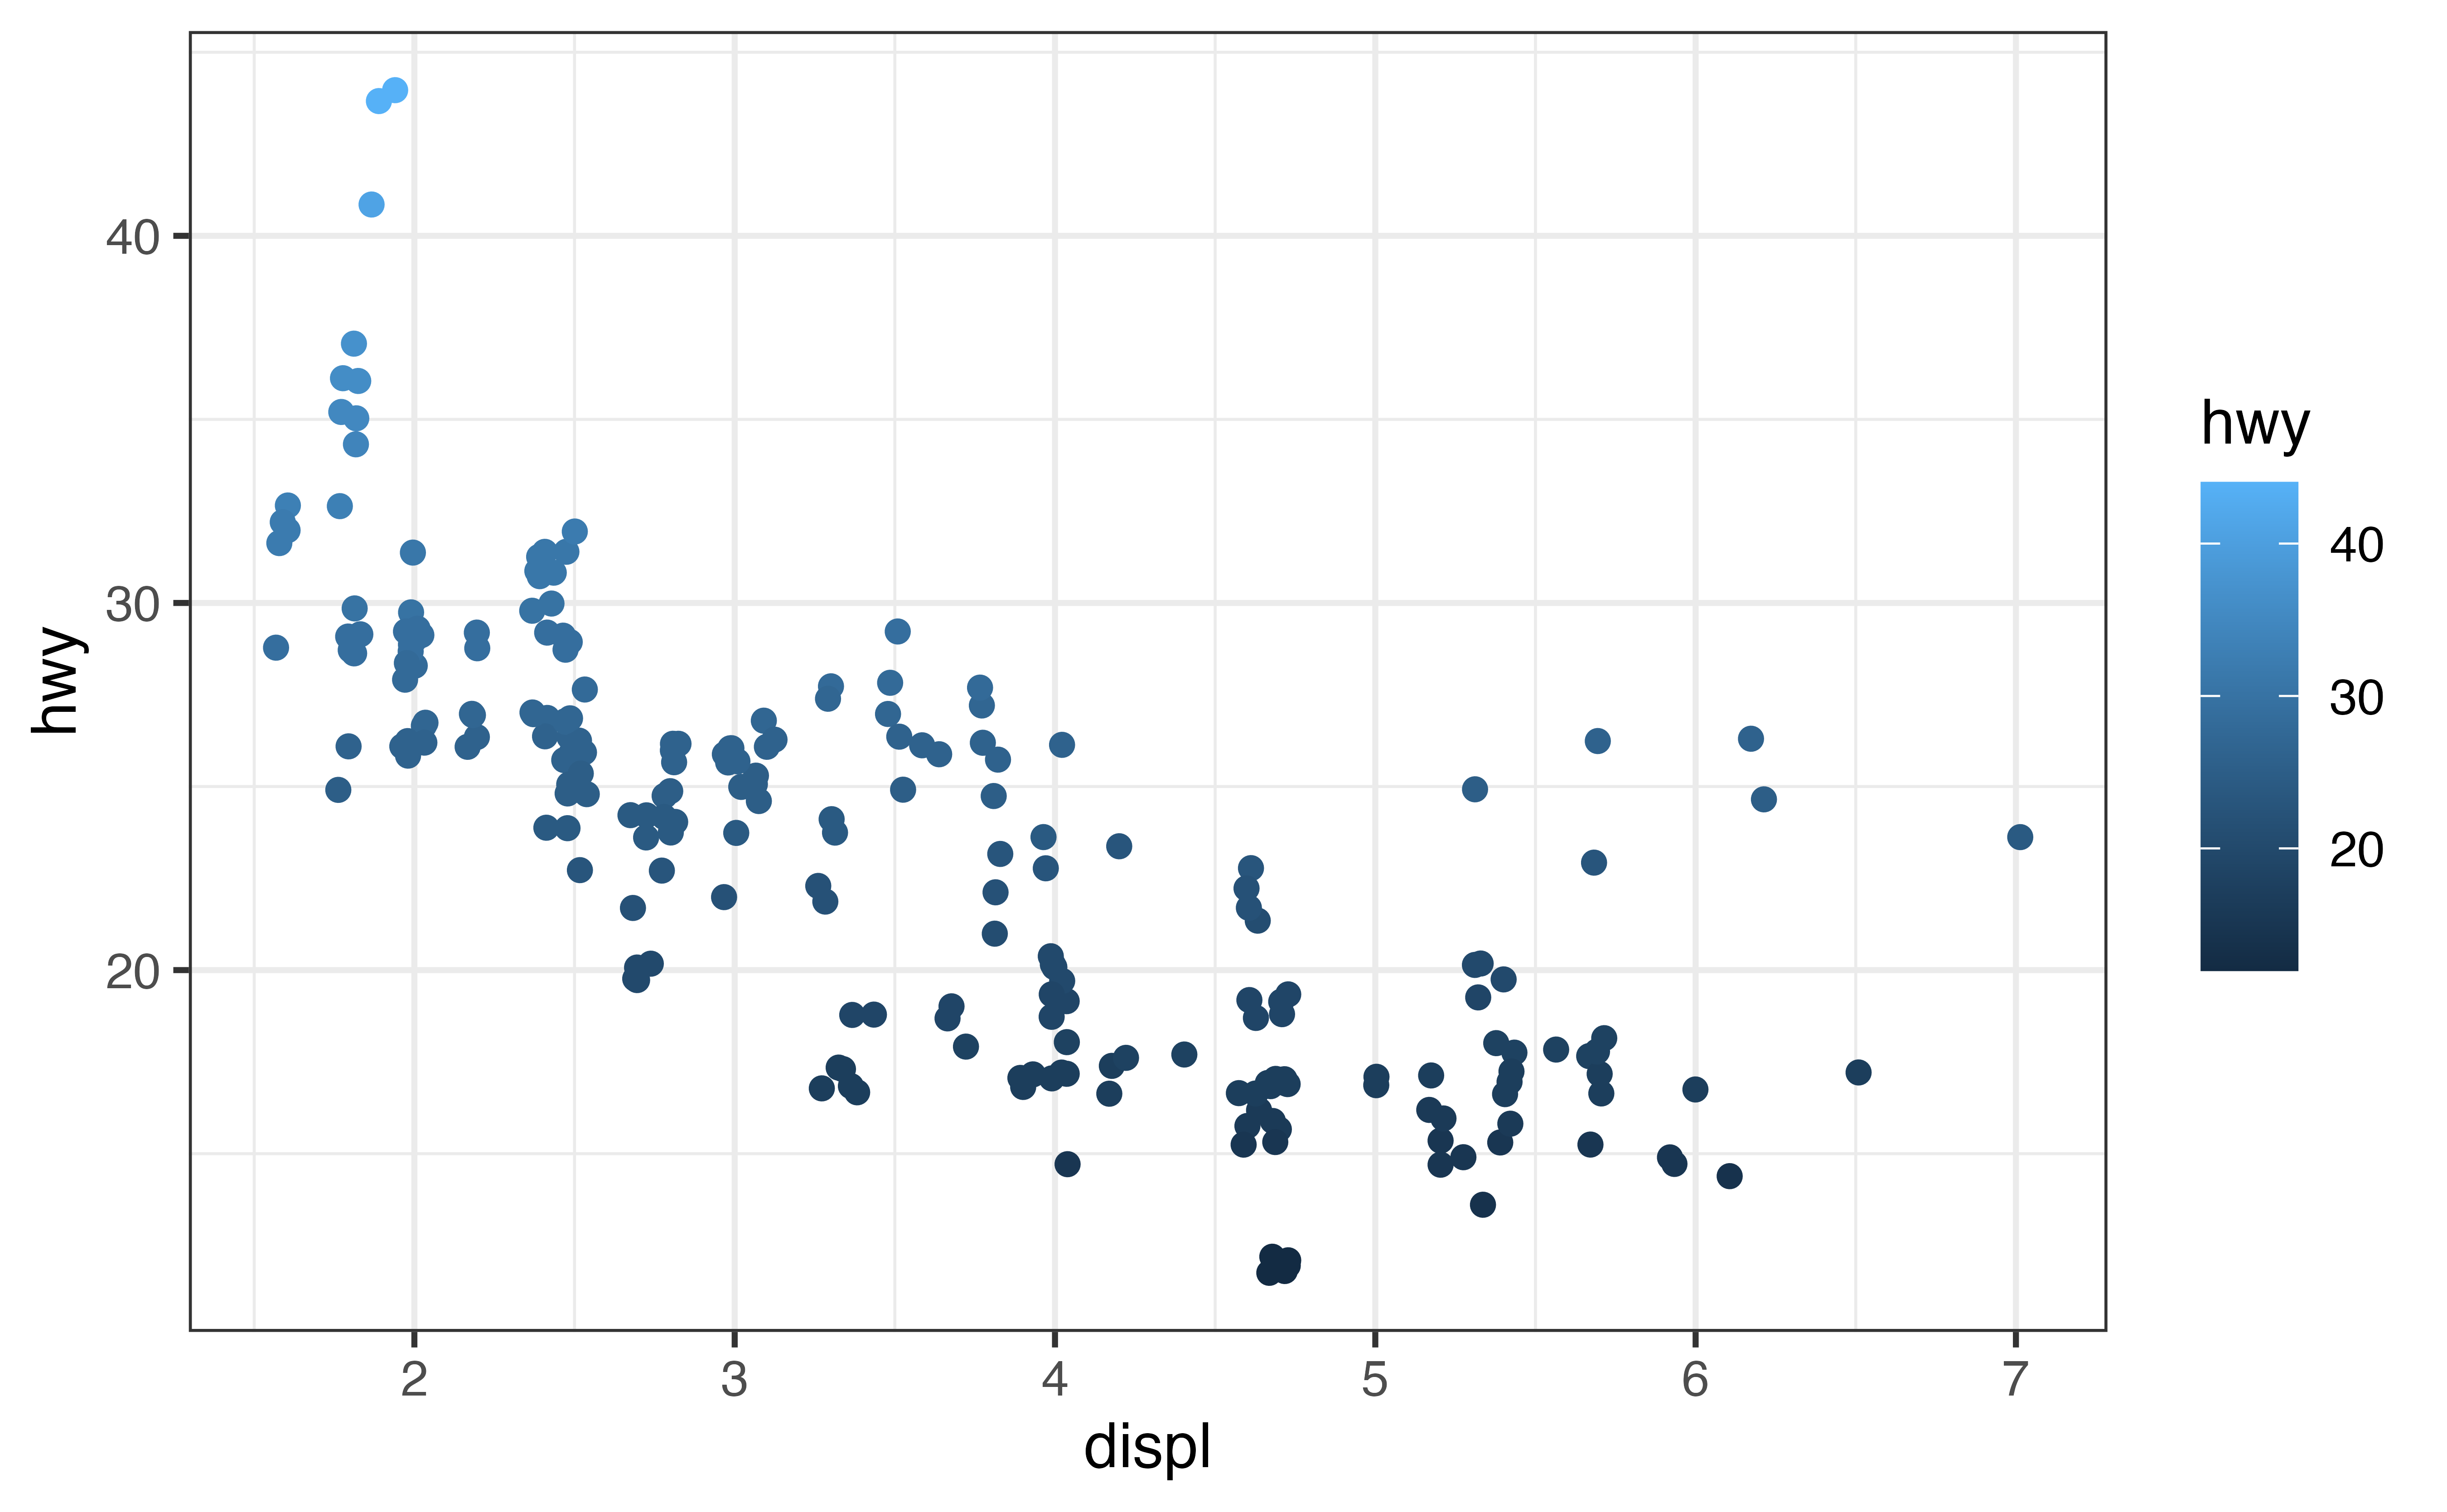
Discrete vs. continuous in action
If we apply scale_color_brewer() to our new plot, we get an error message that confirms what you know: you cannot use a scale that is built for discrete variables to customize the mapping to a continuous variable.
p_cont + scale_color_brewer()Error in `scale_color_brewer()`:
! Continuous value supplied to a discrete scale.
ℹ Example values: 29, 31, 30, 26, and 27.Distiller
Luckily, scale_color_brewer() has a comes with a continuous analogue named scale_color_distiller() (also scale_fill_distiller()).
Use scale_color_distiller() just as you would scale_color_brewer(). scale_color_distiller() will take any {RColorBrewer} palette, and interpolate between colors as necessary to provide an entire continuous range of colors.
So for example, we could reuse the Spectral palette in our continuous plot
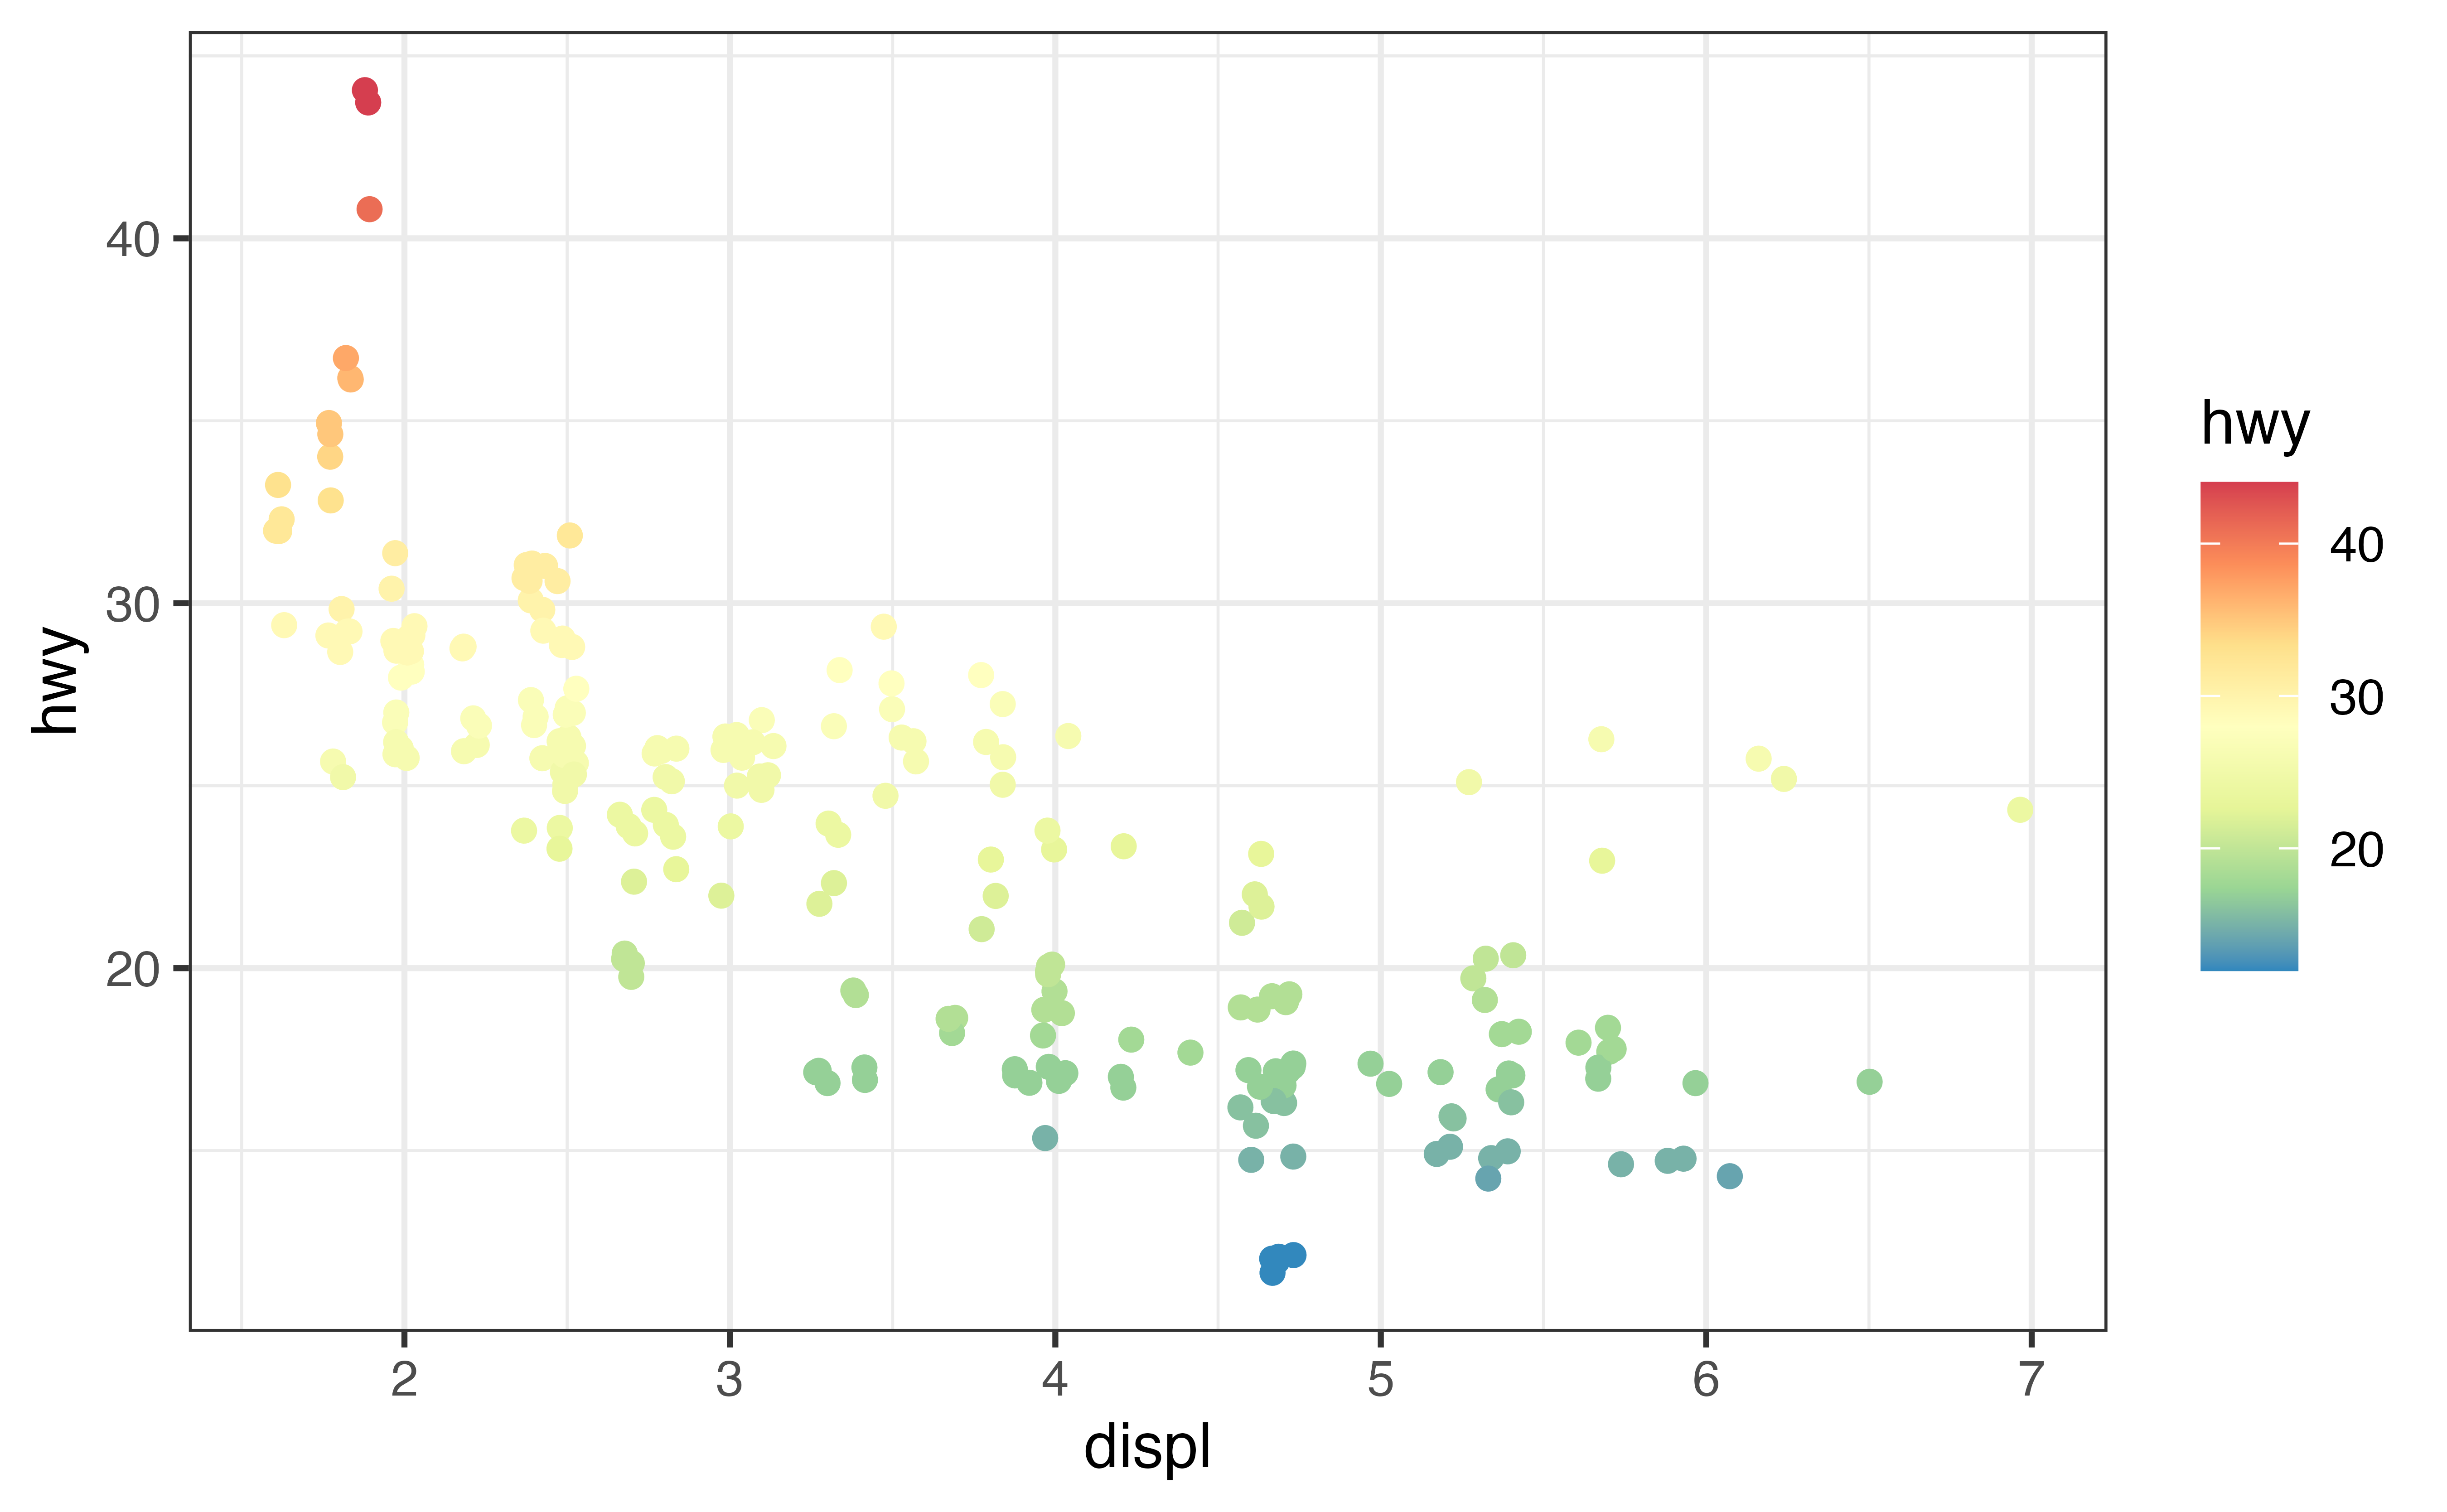
p_cont + scale_color_distiller(palette = "Spectral")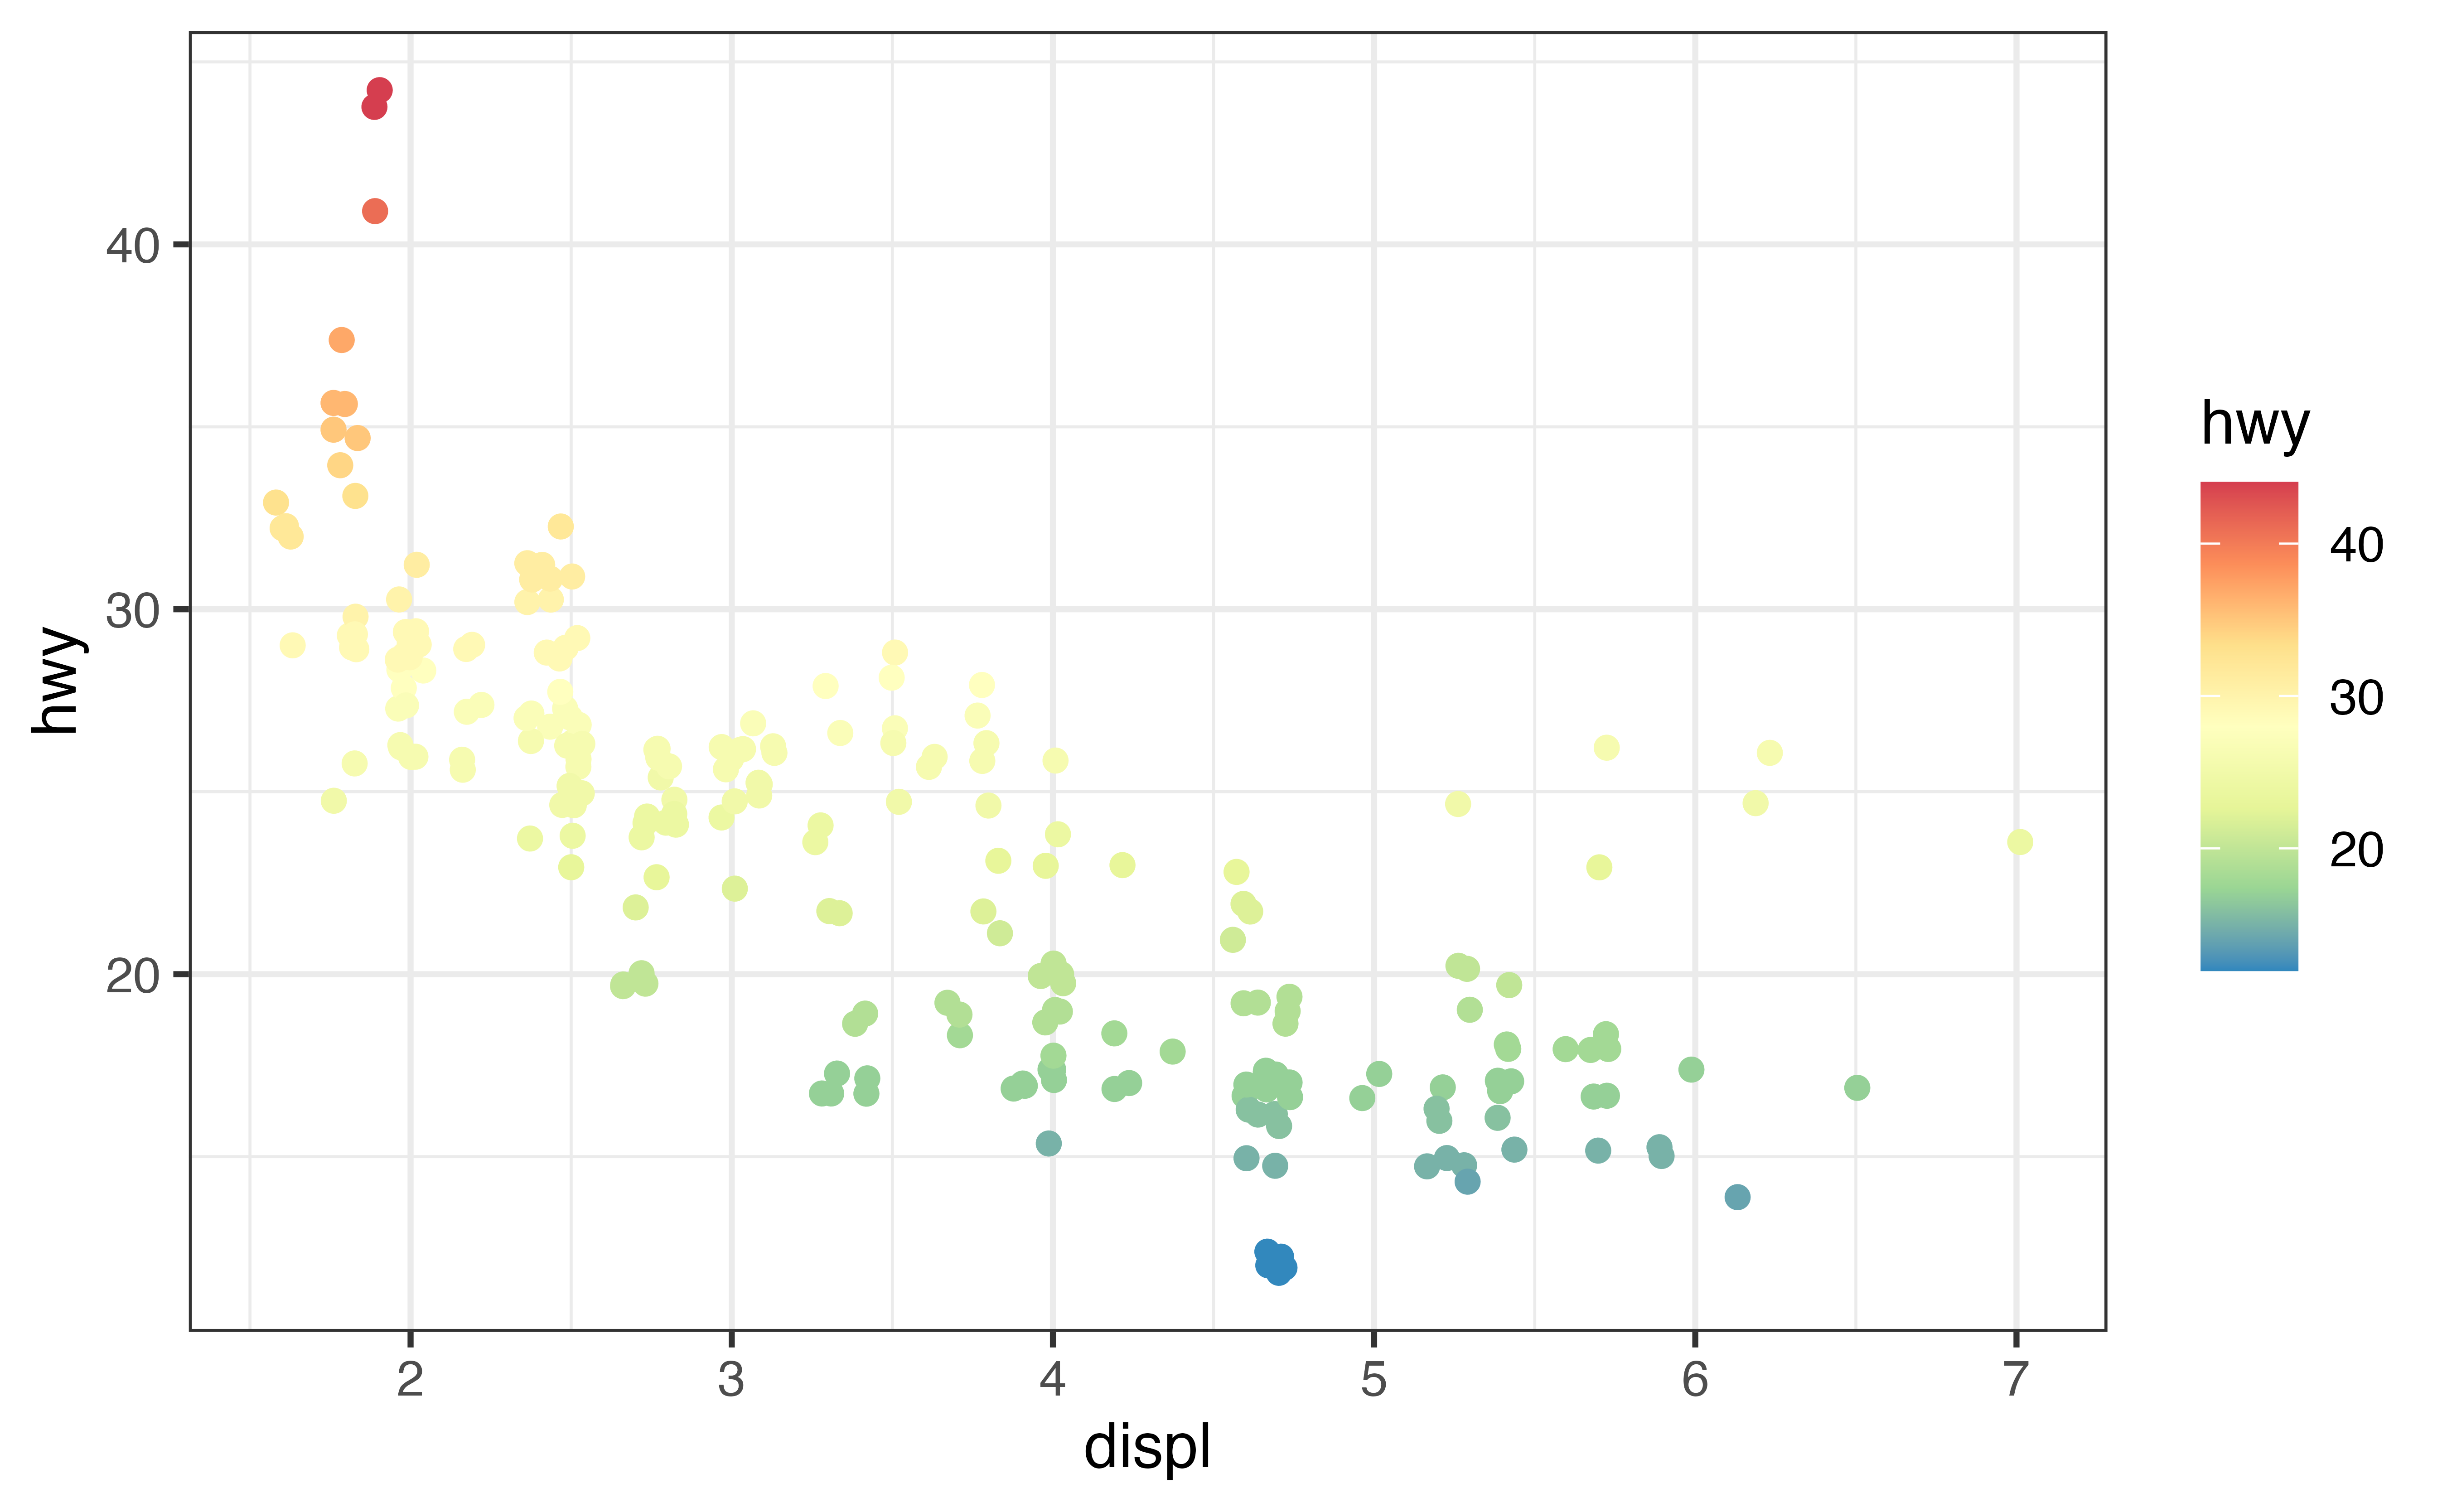
Exercise: scale_color_distiller()
Recreate the graph below, which uses a different palette from the {RColorBrewer} package.
p_cont + scale_color_distiller(palette = "BrBG")Good job! {ggplot2} also supplies scale_color_gradient(), scale_color_gradient2(), and scale_color_gradientn(), which you can use to construct gradients manually between 2, 3, and n colors.
viridis
The {viridis} package contains a collection of very good looking color palettes for both discrete and continuous variables. Each palette is designed to show the gradation of continuous values in an attractive, and perceptually uniform way (no range of values appears more important than another). As a bonus, the palettes are both colorblind and black-and-white printer friendly!
To add a continuous viridis palette, use scale_color_viridis_c() or scale_fill_viridis_c(); for a discrete viridis palette, use scale_color_viridis_d() or scale_fill_viridis_d(), both of which come in the {ggplot2} package.
p1 + scale_color_viridis_d()
p_cont + scale_color_viridis_c()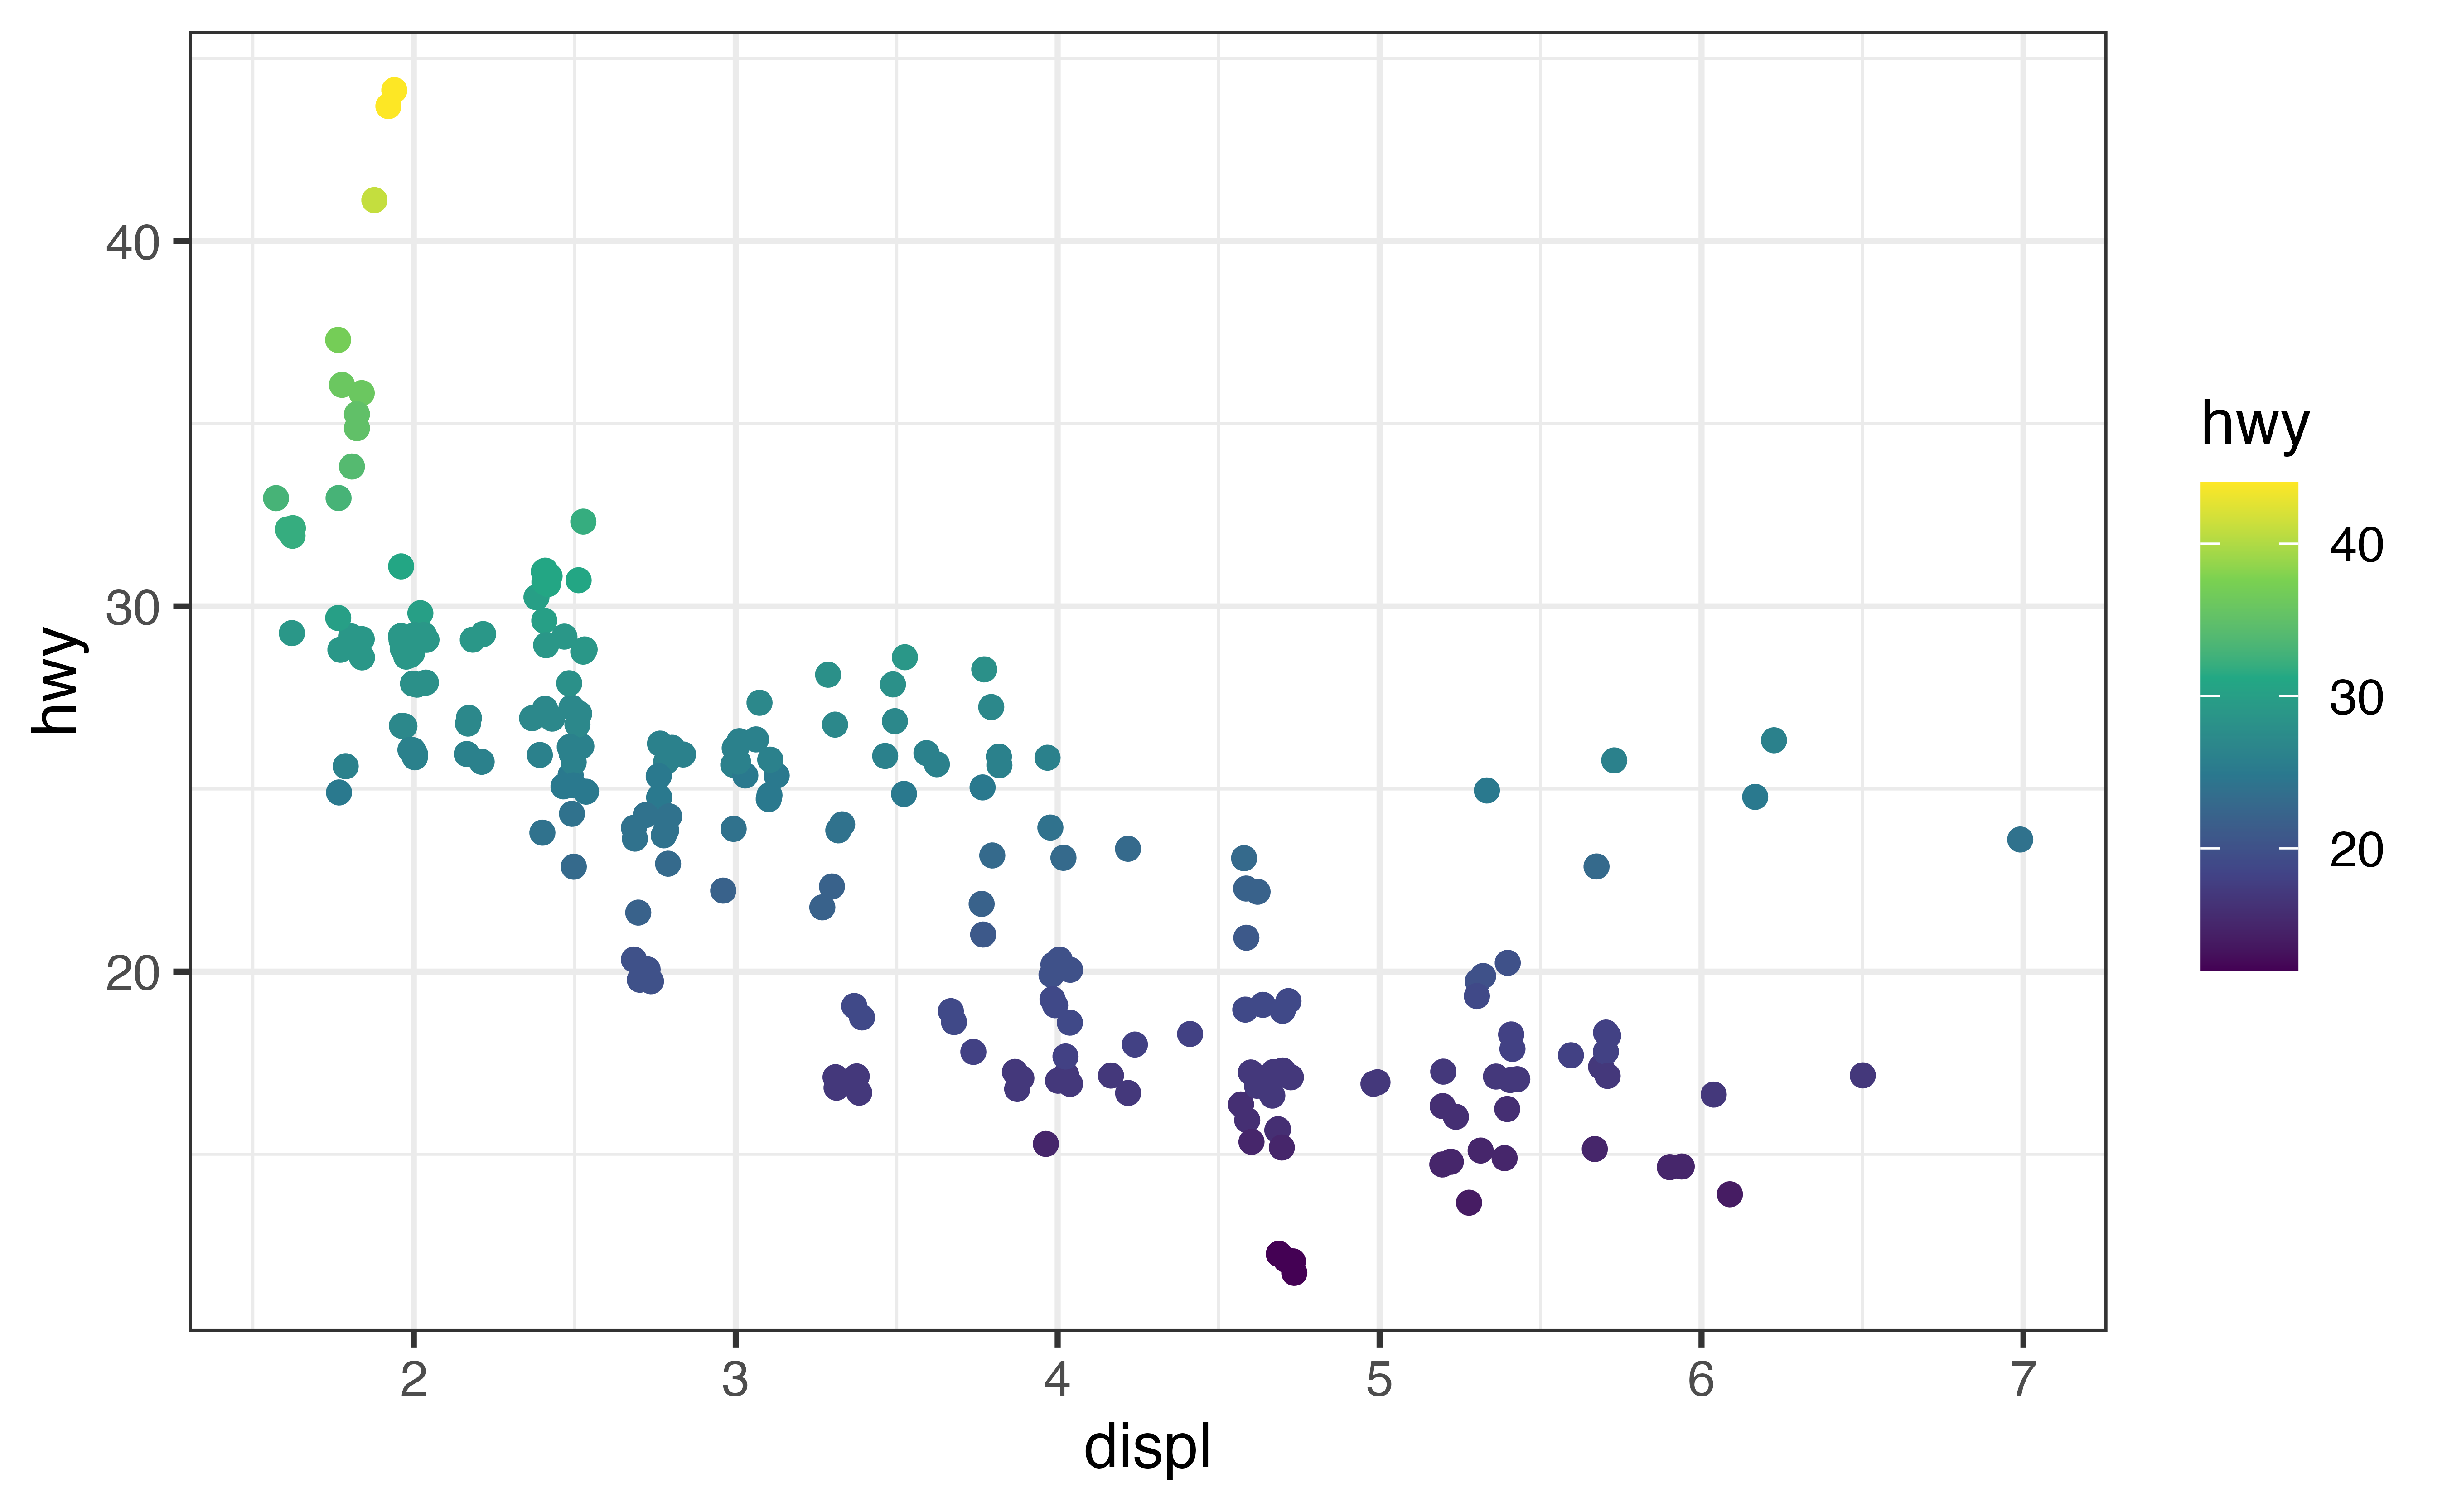
viridis options
Altogether, the viridis package comes with eight color palettes, named viridis, magma, plasma, inferno, cividis, mako, rocket, and turbo.
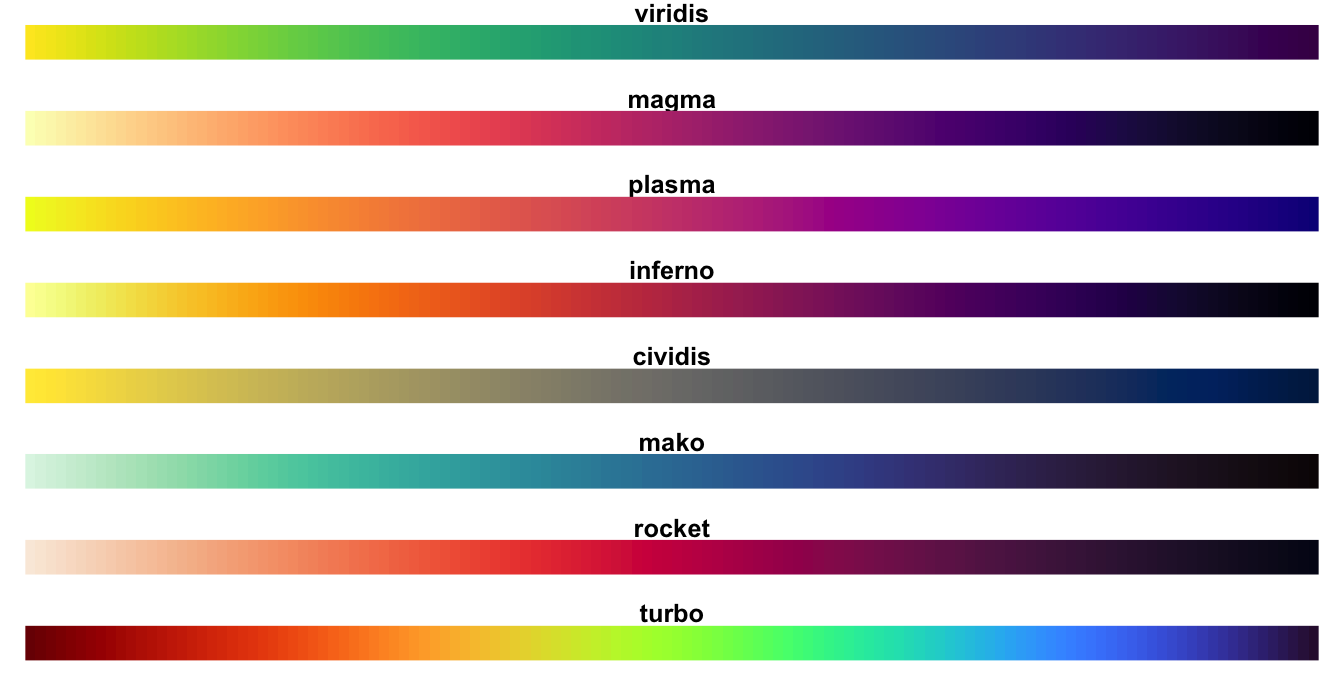
Try each option with p_cont below. Determine which is the default.
p_cont + scale_color_viridis_c(option = "viridis")Good job! viridis is the default if you do not select a scale.