Themes
One of the most effective ways to control the look of your plot is with a theme.
What is a theme?
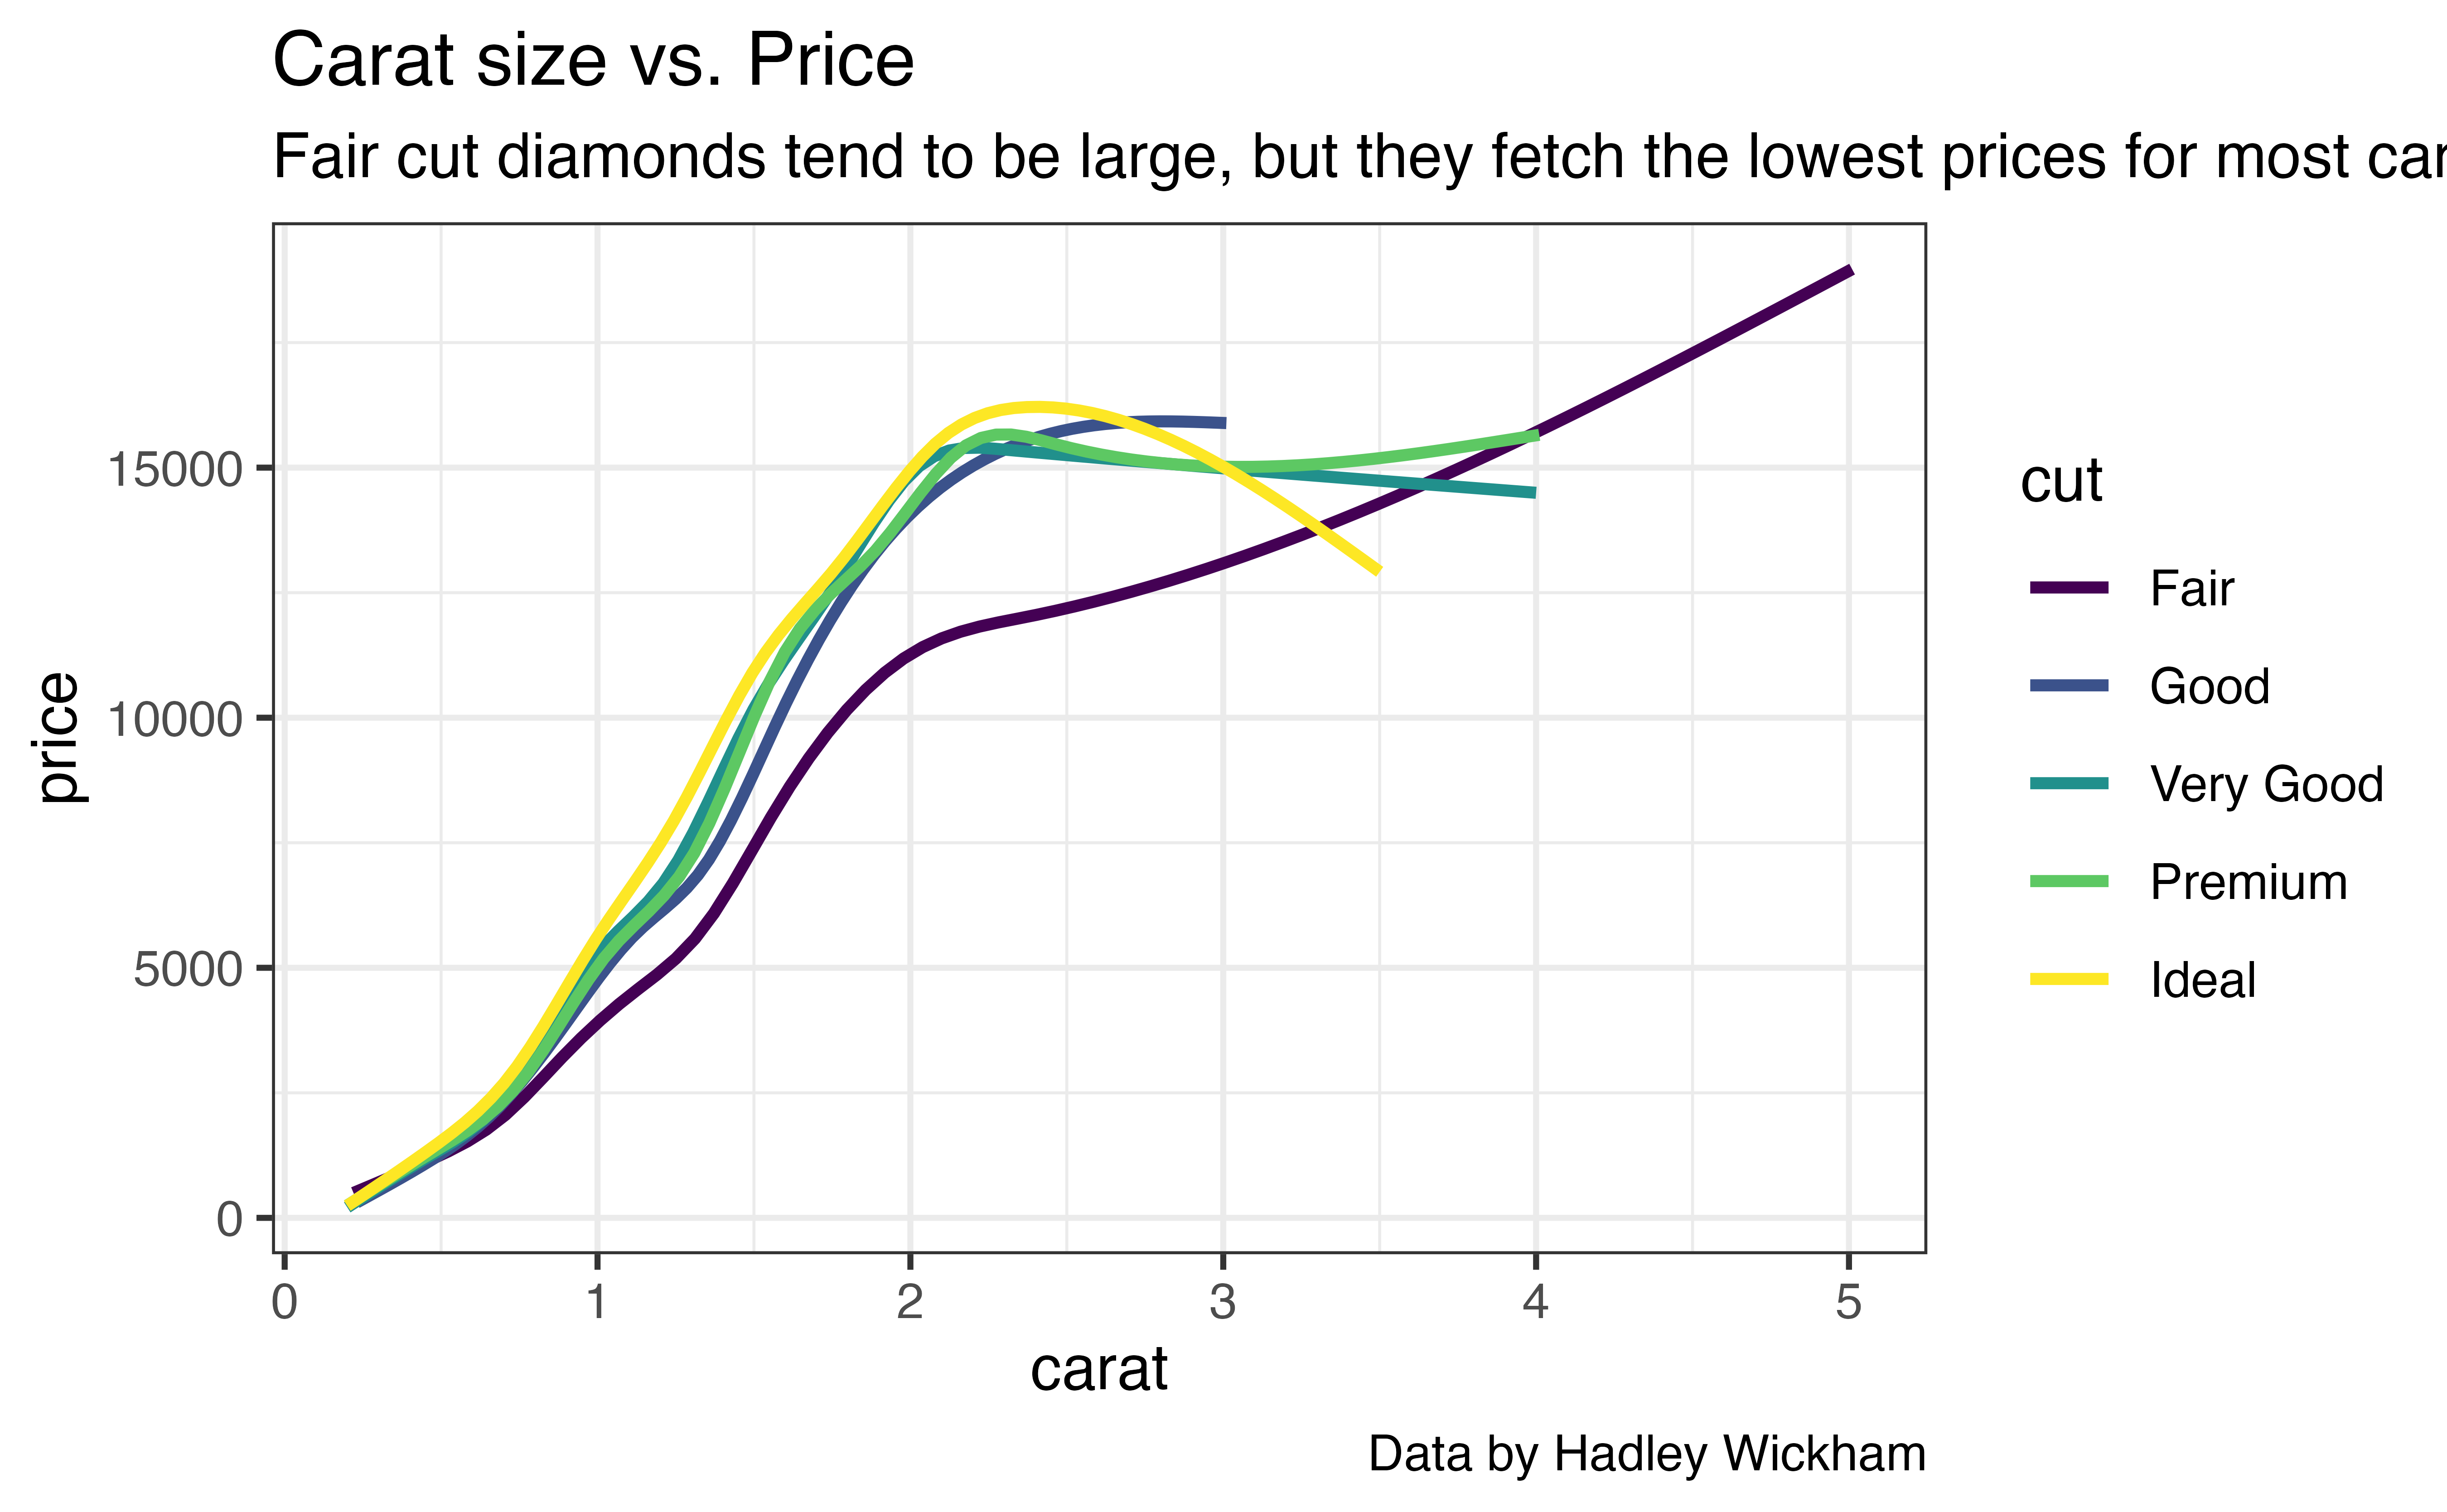
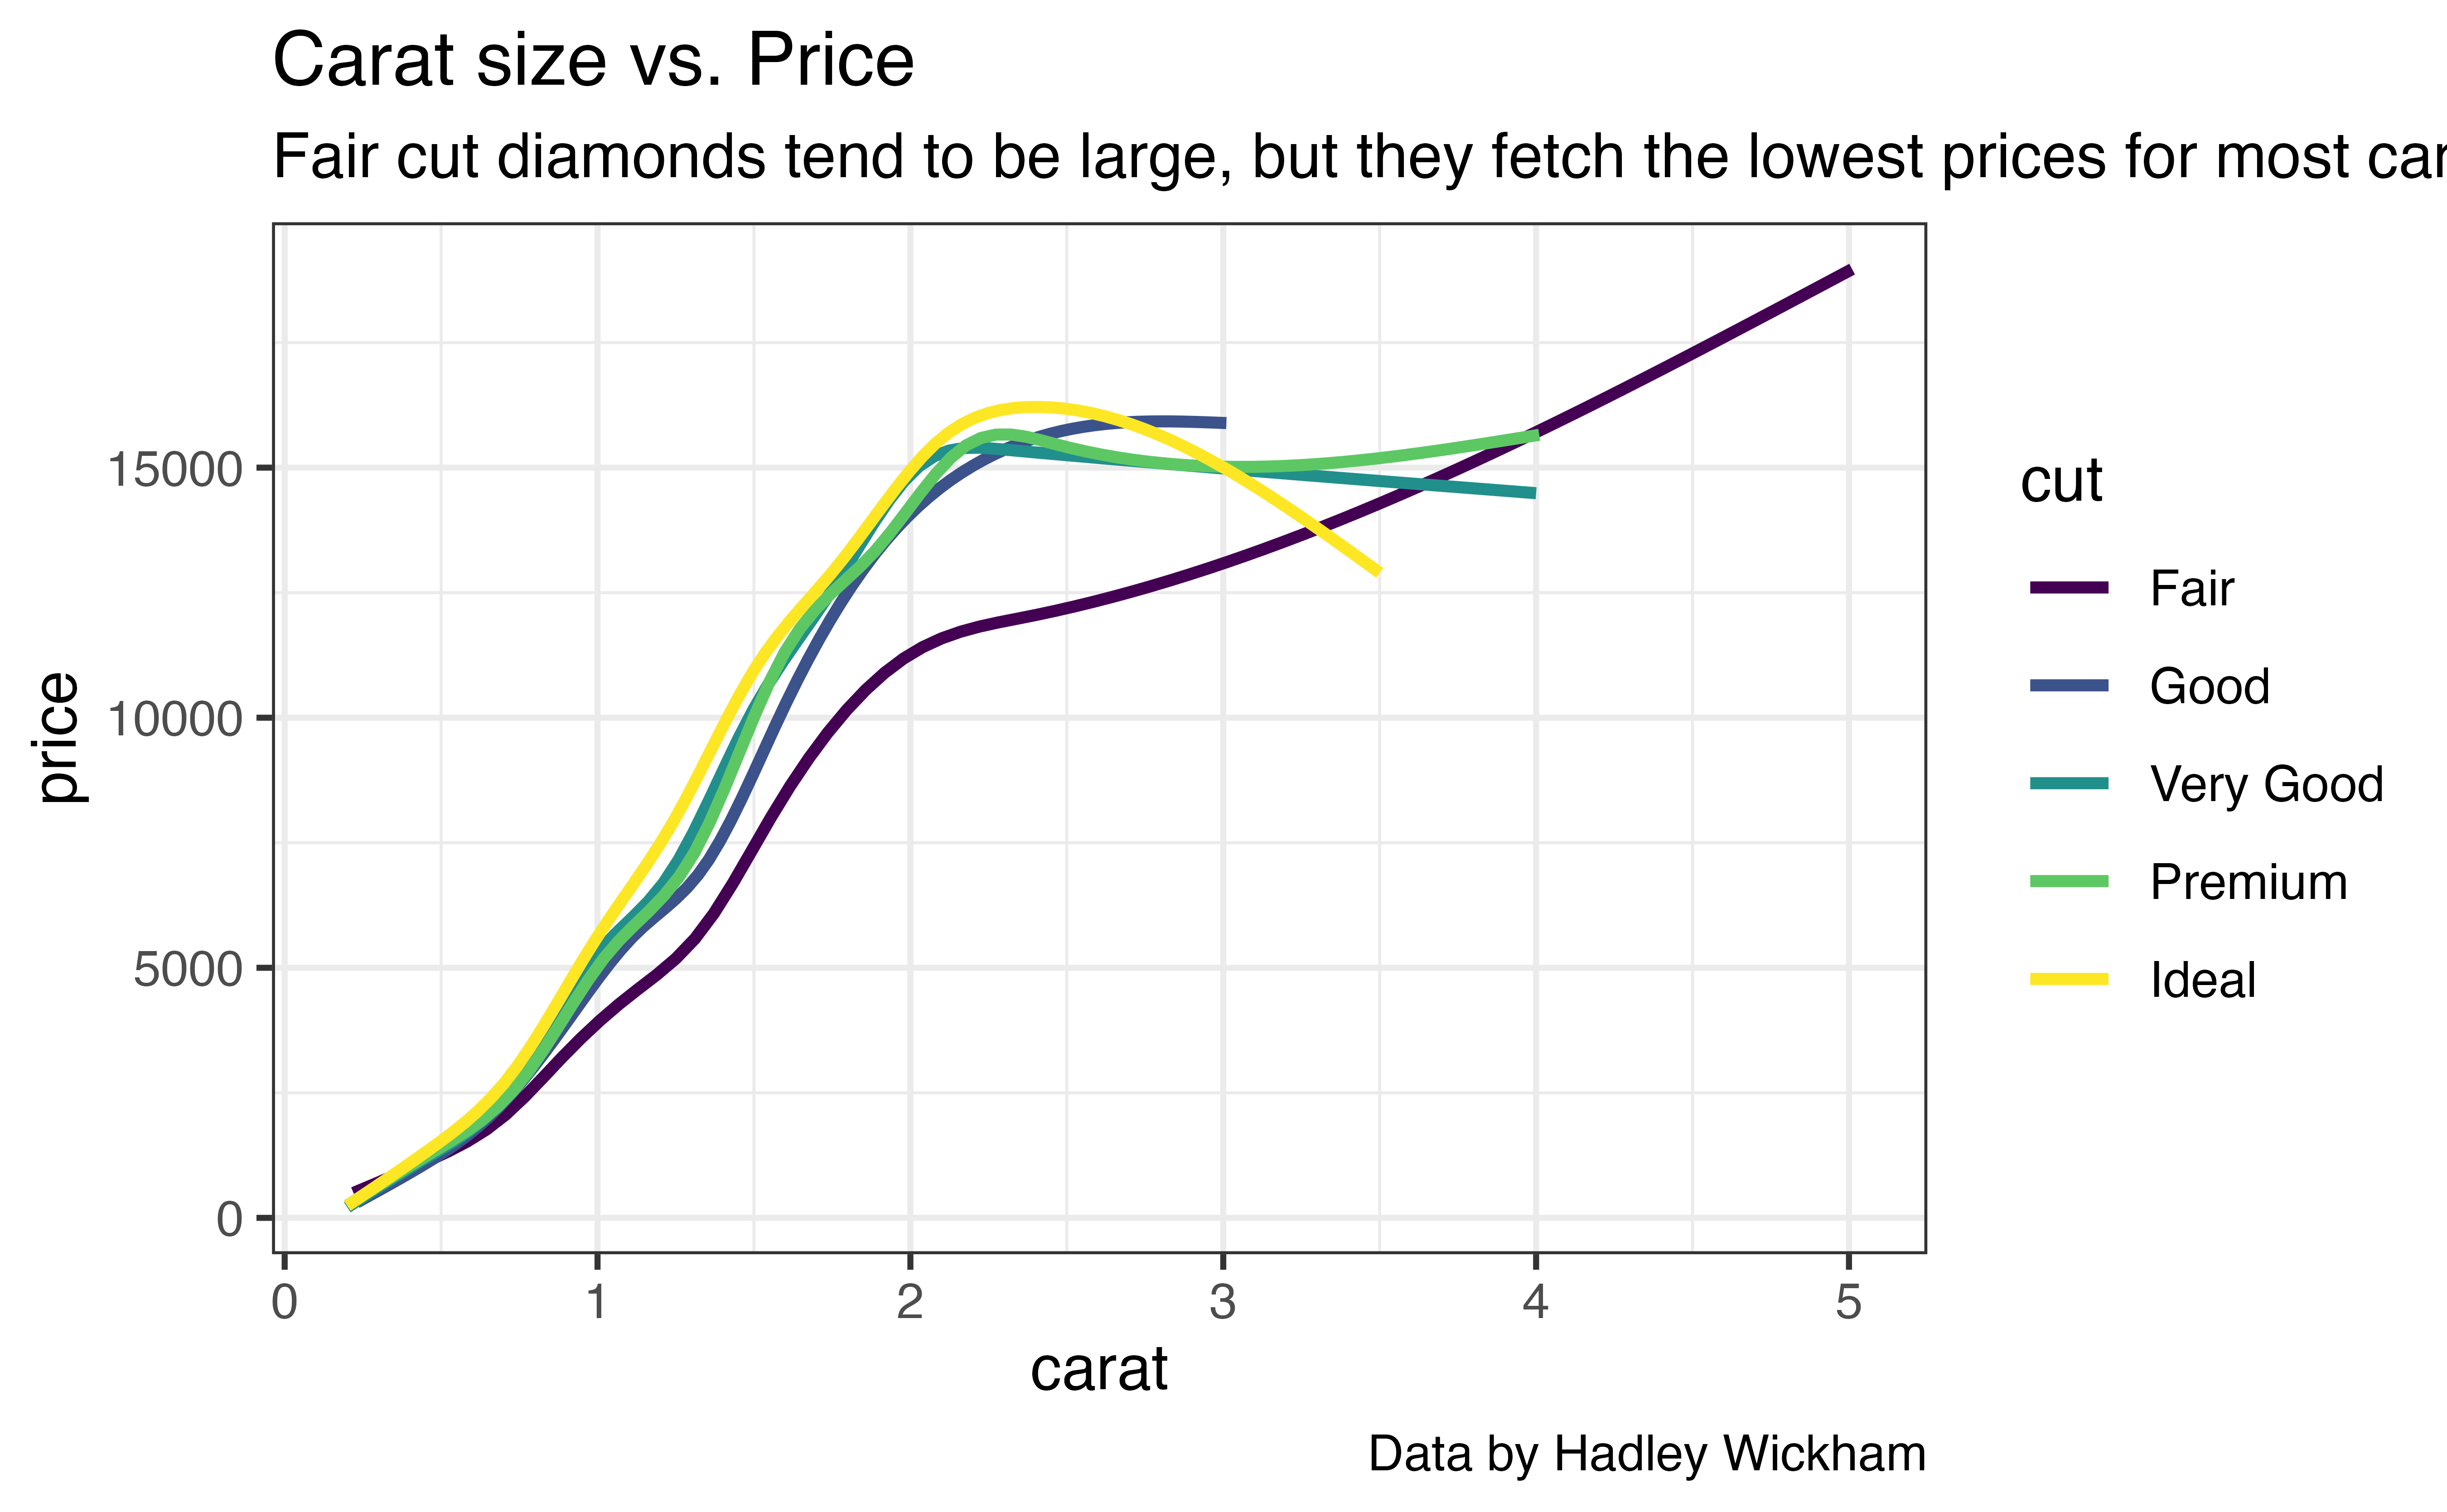
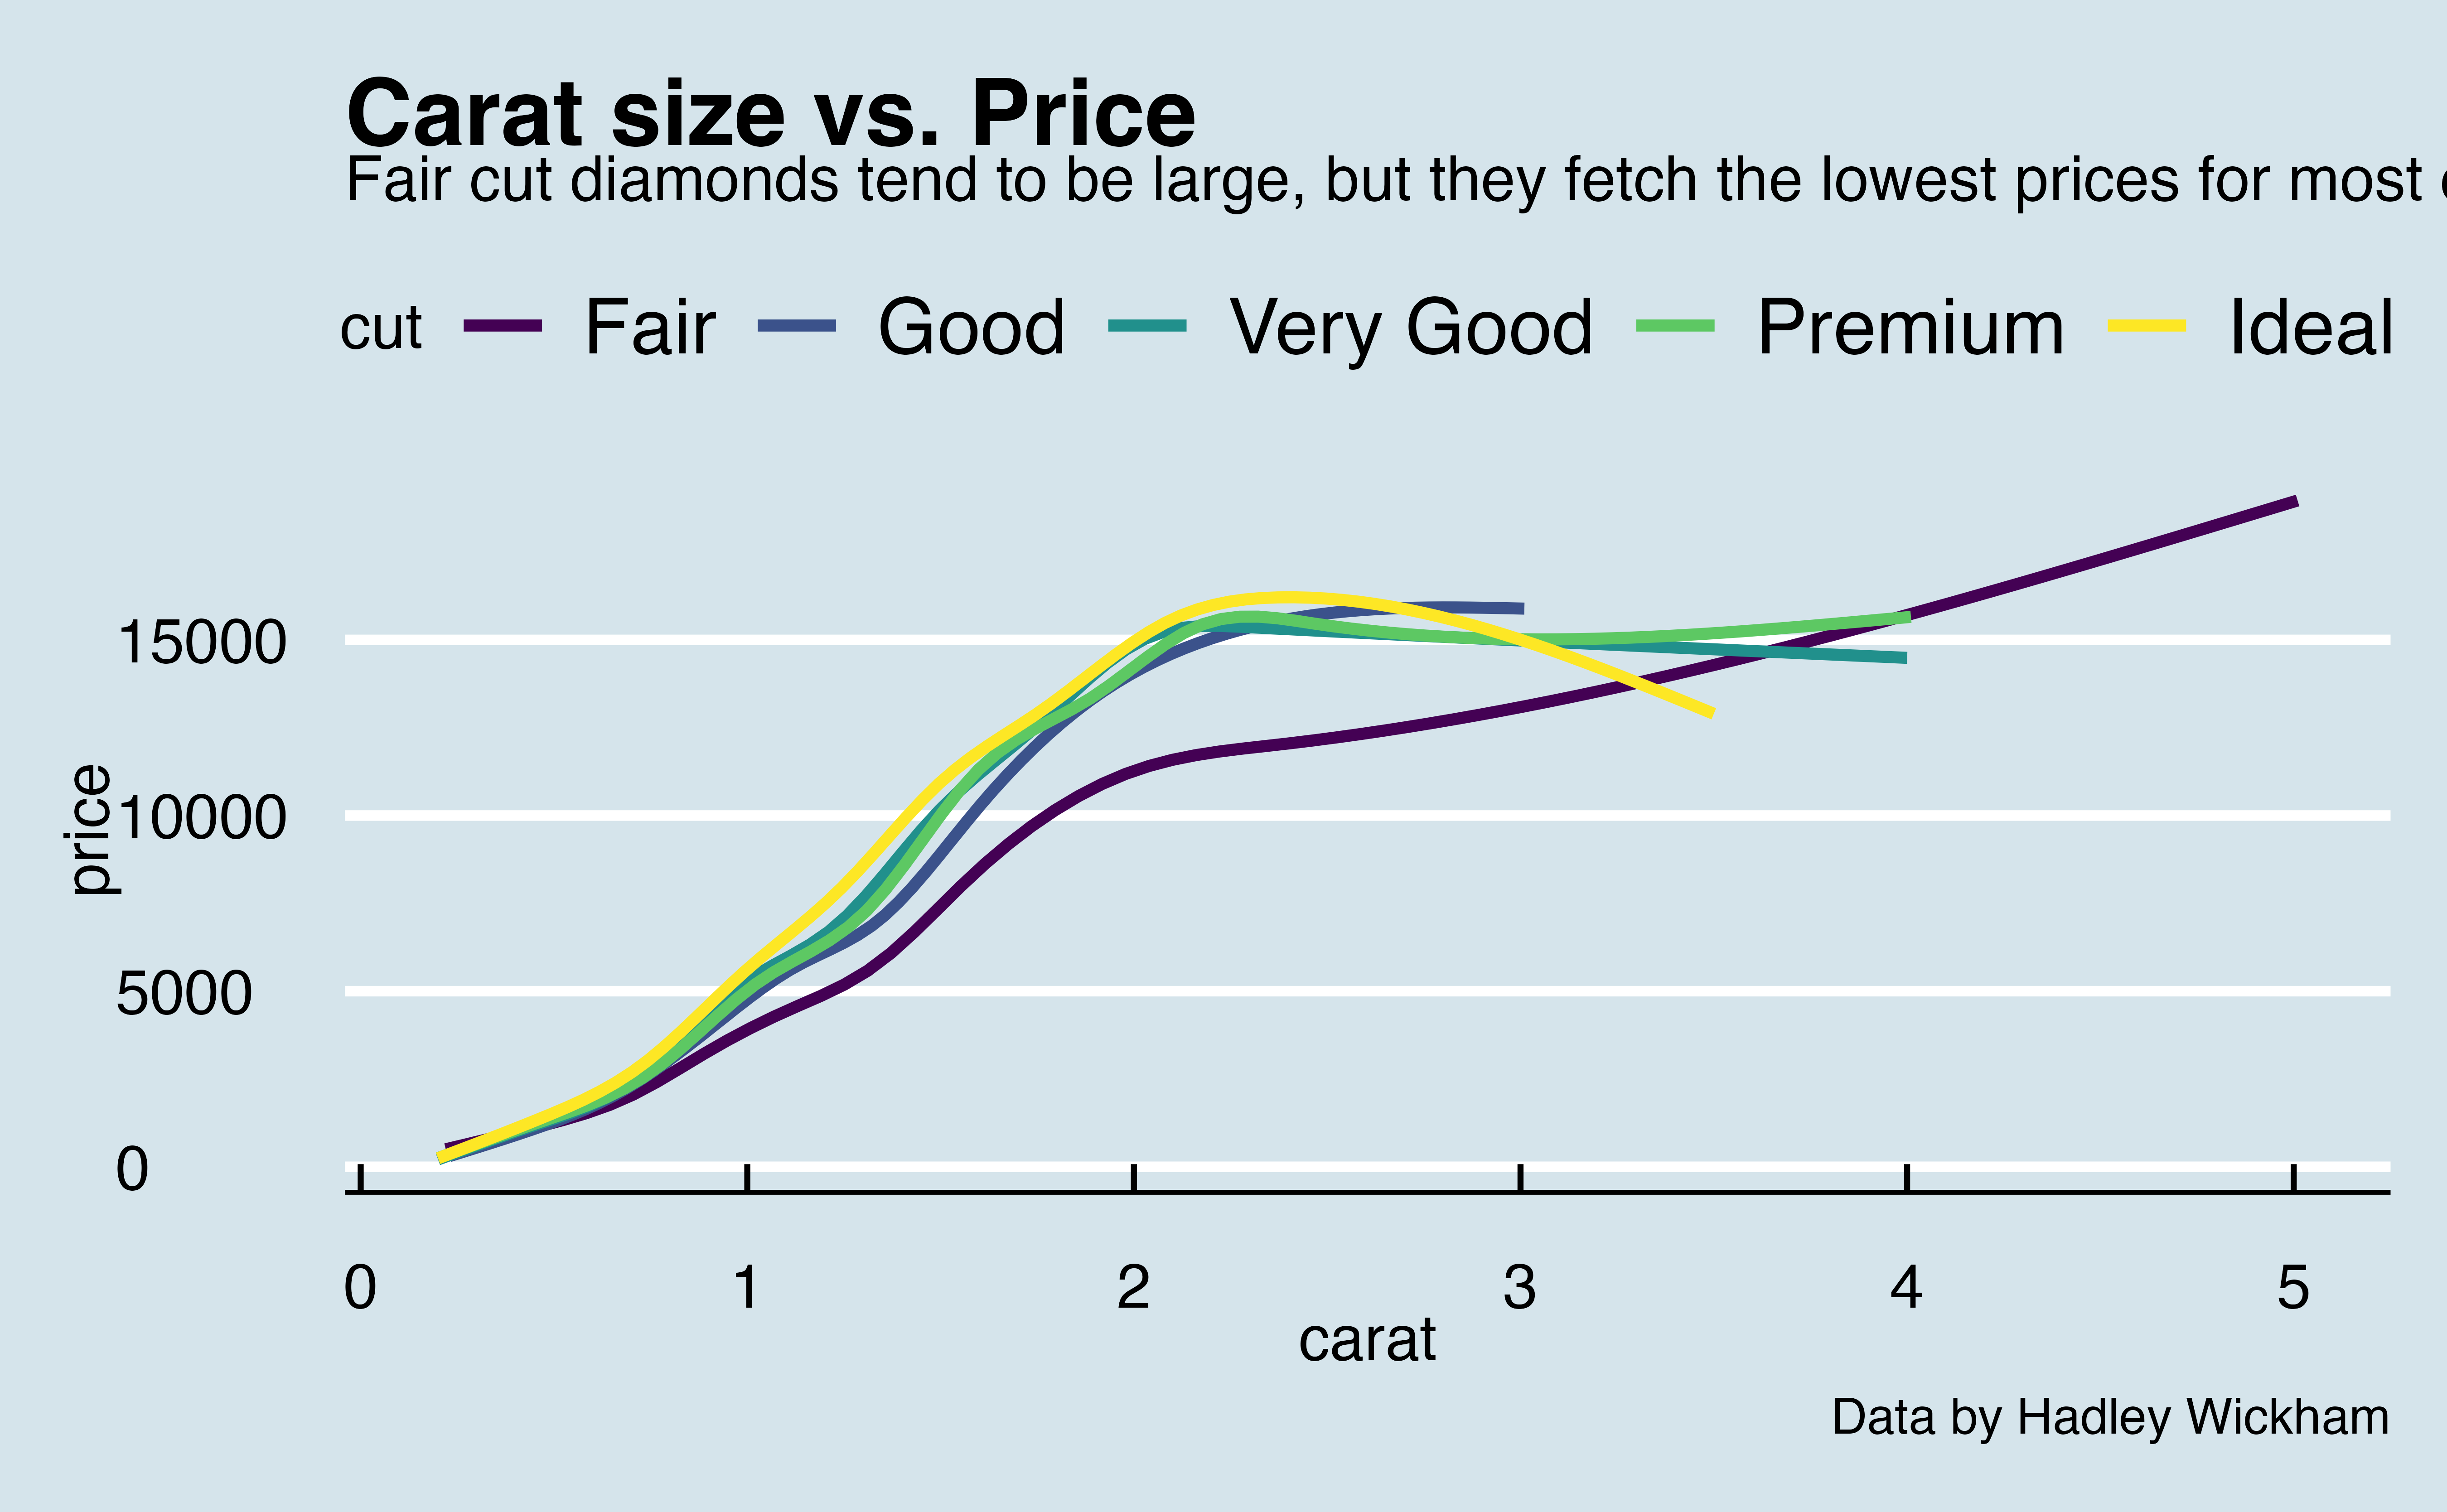
A theme describes how the non-data elements of your plot should look. For example, these two plots show the same data, but they use two very different themes.
Theme functions
To change the theme of your plot, add a theme_ function to your plot call. The {ggplot2} package provides eight theme functions to choose from.
theme_bw()theme_classic()theme_dark()theme_gray()theme_light()theme_linedraw()theme_minimal()theme_void()
Use the box below to plot p1 with each of the themes. Which theme do you prefer? Which theme does {ggplot2} apply by default?
Good job! {ggplot2} uses theme_gray() by default.
{ggthemes}
If you would like to give your graph a more complete makeover, the {ggthemes} package provides extra themes that imitate the graph styles of popular software packages and publications. These include:
theme_base()theme_calc()theme_economist()theme_economist_white()theme_excel()theme_few()theme_fivethirtyeight()theme_foundation()theme_gdocs()theme_hc()theme_igray()theme_map()theme_pander()theme_par()theme_solarized()theme_solarized_2()theme_solid()theme_stata()theme_tufte()theme_wsj()
Try plotting p1 with at least two or three of the themes mentioned above.
p1 + theme_wsj()Good job! Notice that each theme supplies its own font sizes, which means that your captions might run off the page for some themes. In practice, you can fix this by resizing your graph window.
Update p1
If you compare the {ggtheme} themes to the styles they imitate, you might notice something: the colors used to plot your data haven’t changed. The colors are noticeably {ggplot2} colors. In the next section, we’ll look at how to customize this remaining part of your graph: the data elements.
Before we go on, I suggest that we update p1 to use theme_bw(). It will make our next set of modifications easier to see.
p1 <- p1 + theme_bw()
p1